

What is Flozu?
At midnight on Black Friday the shop slowed to a crawl, and by morning nobody could say why. The architecture diagram on the wiki showed every box and arrow, but not which box ran out of room first. That’s the question Flozu answers, before the day comes.
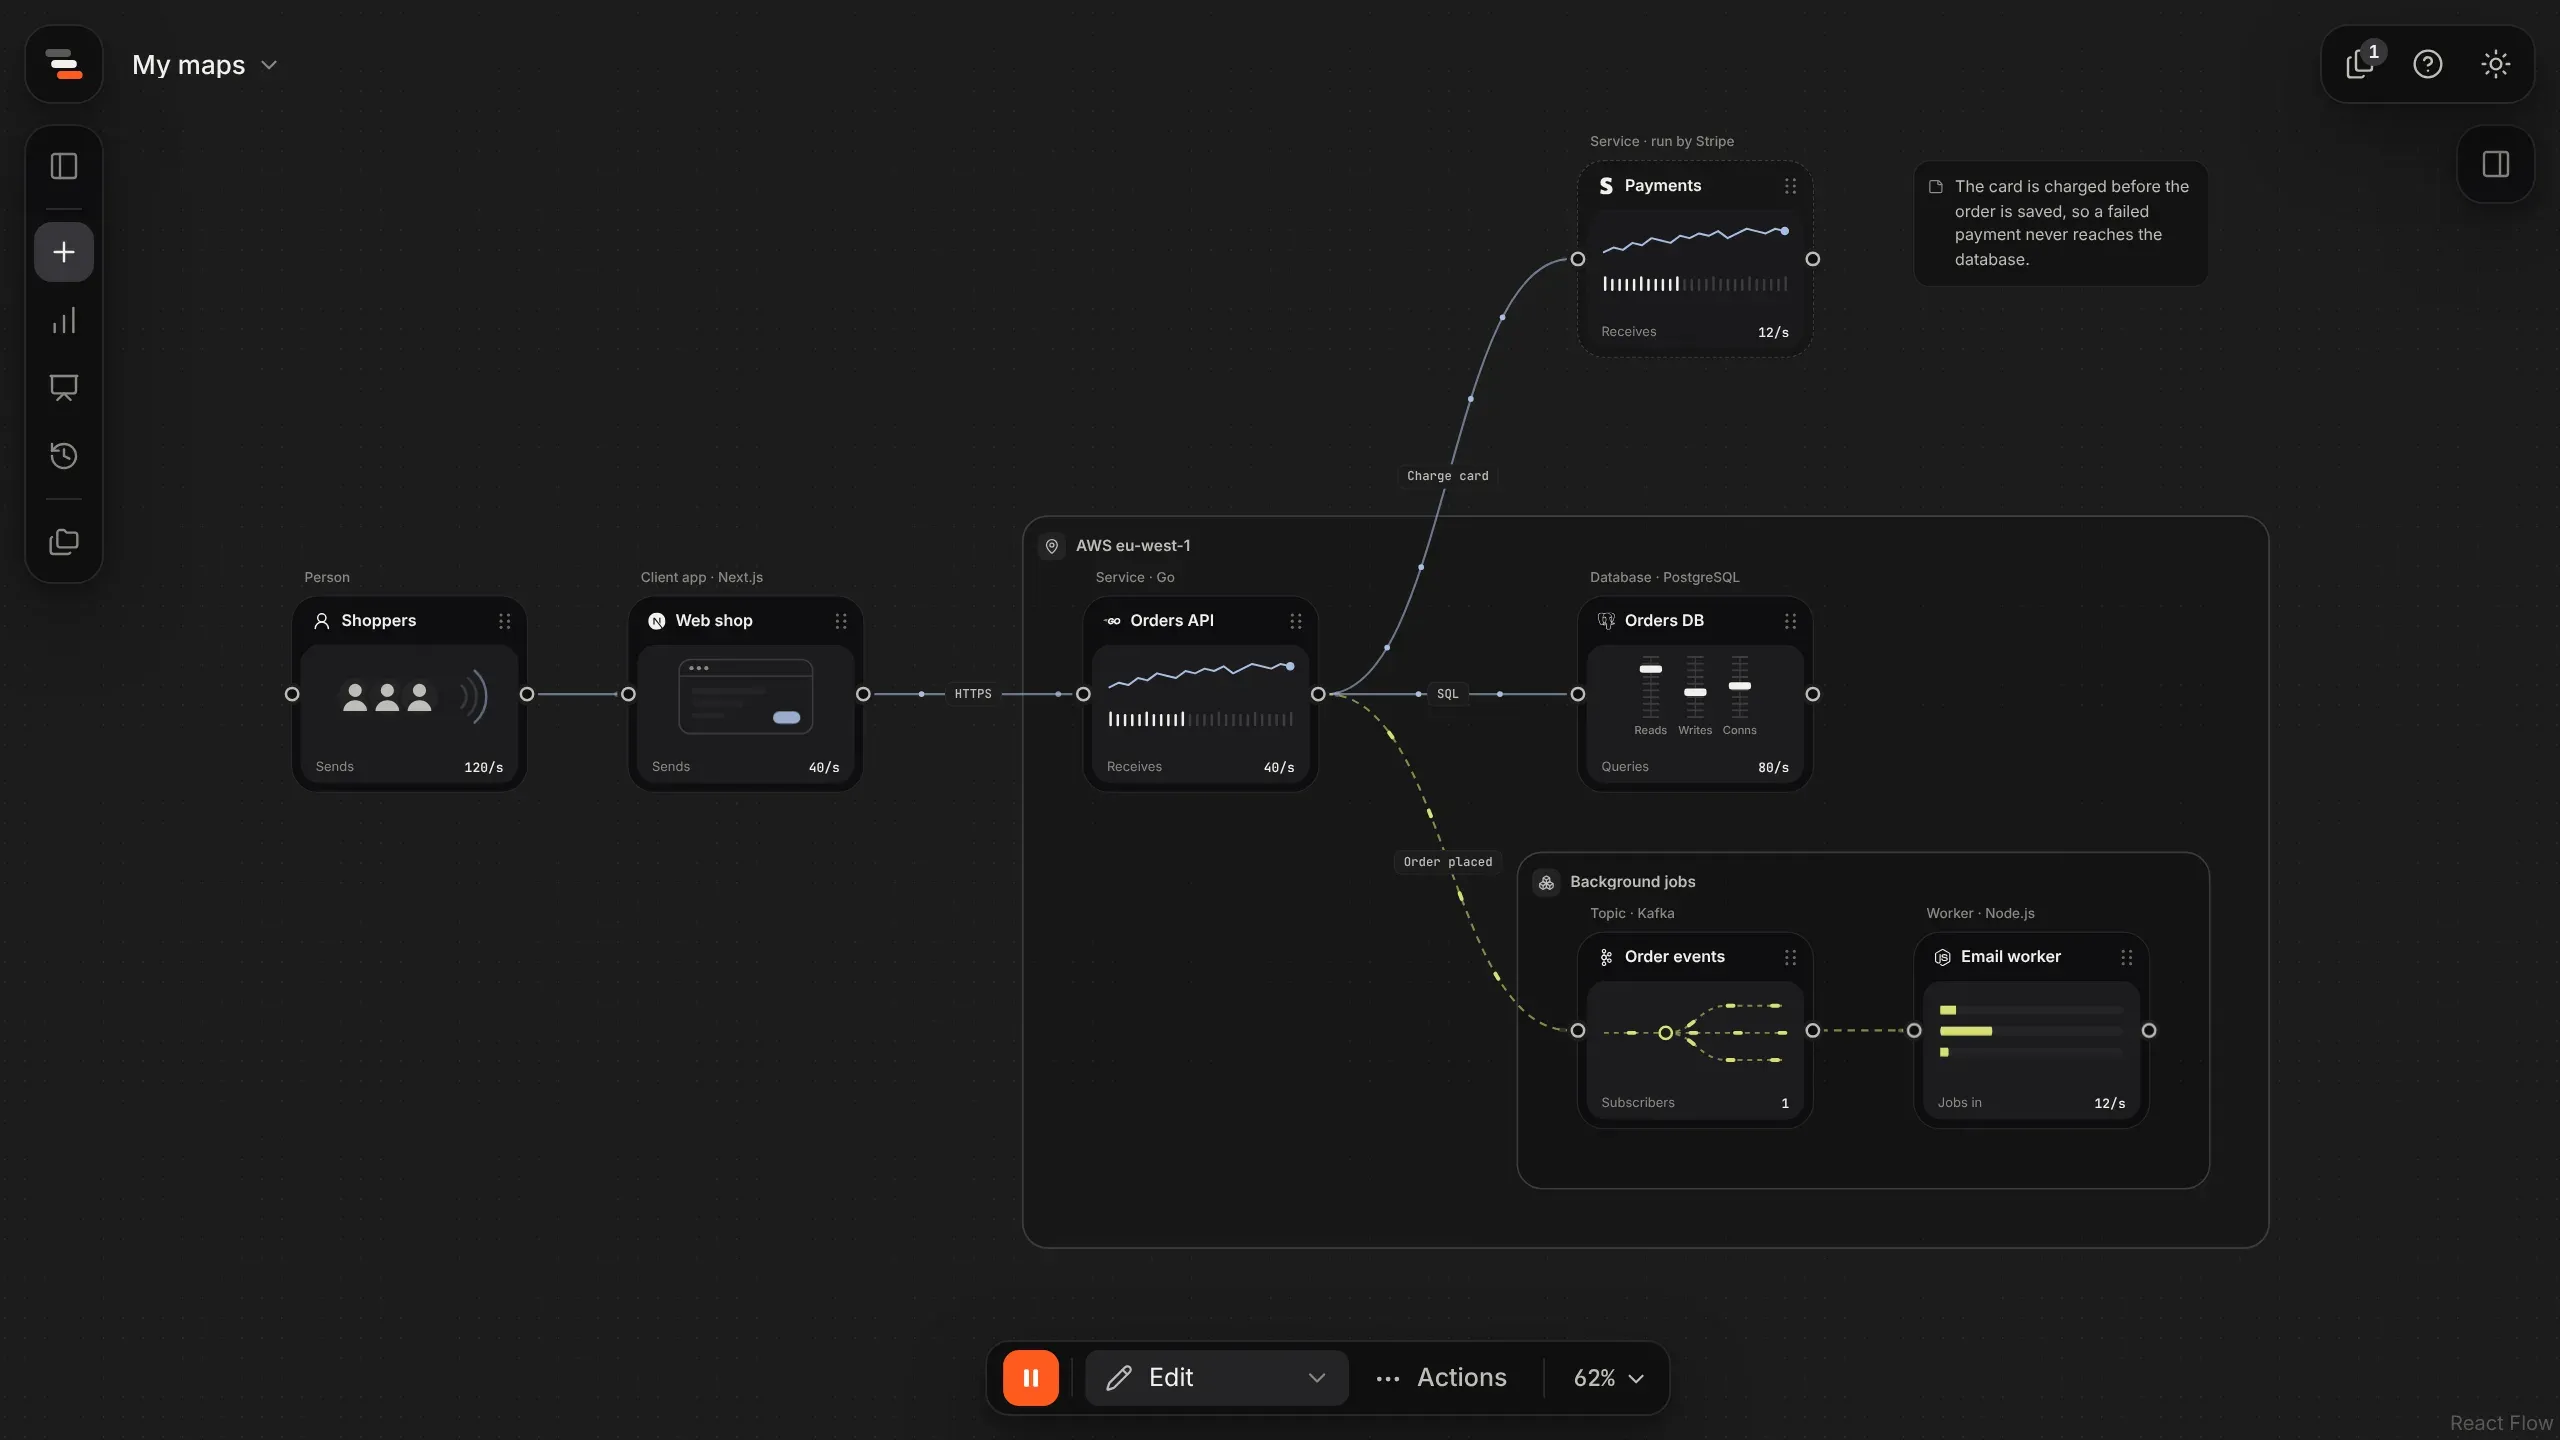
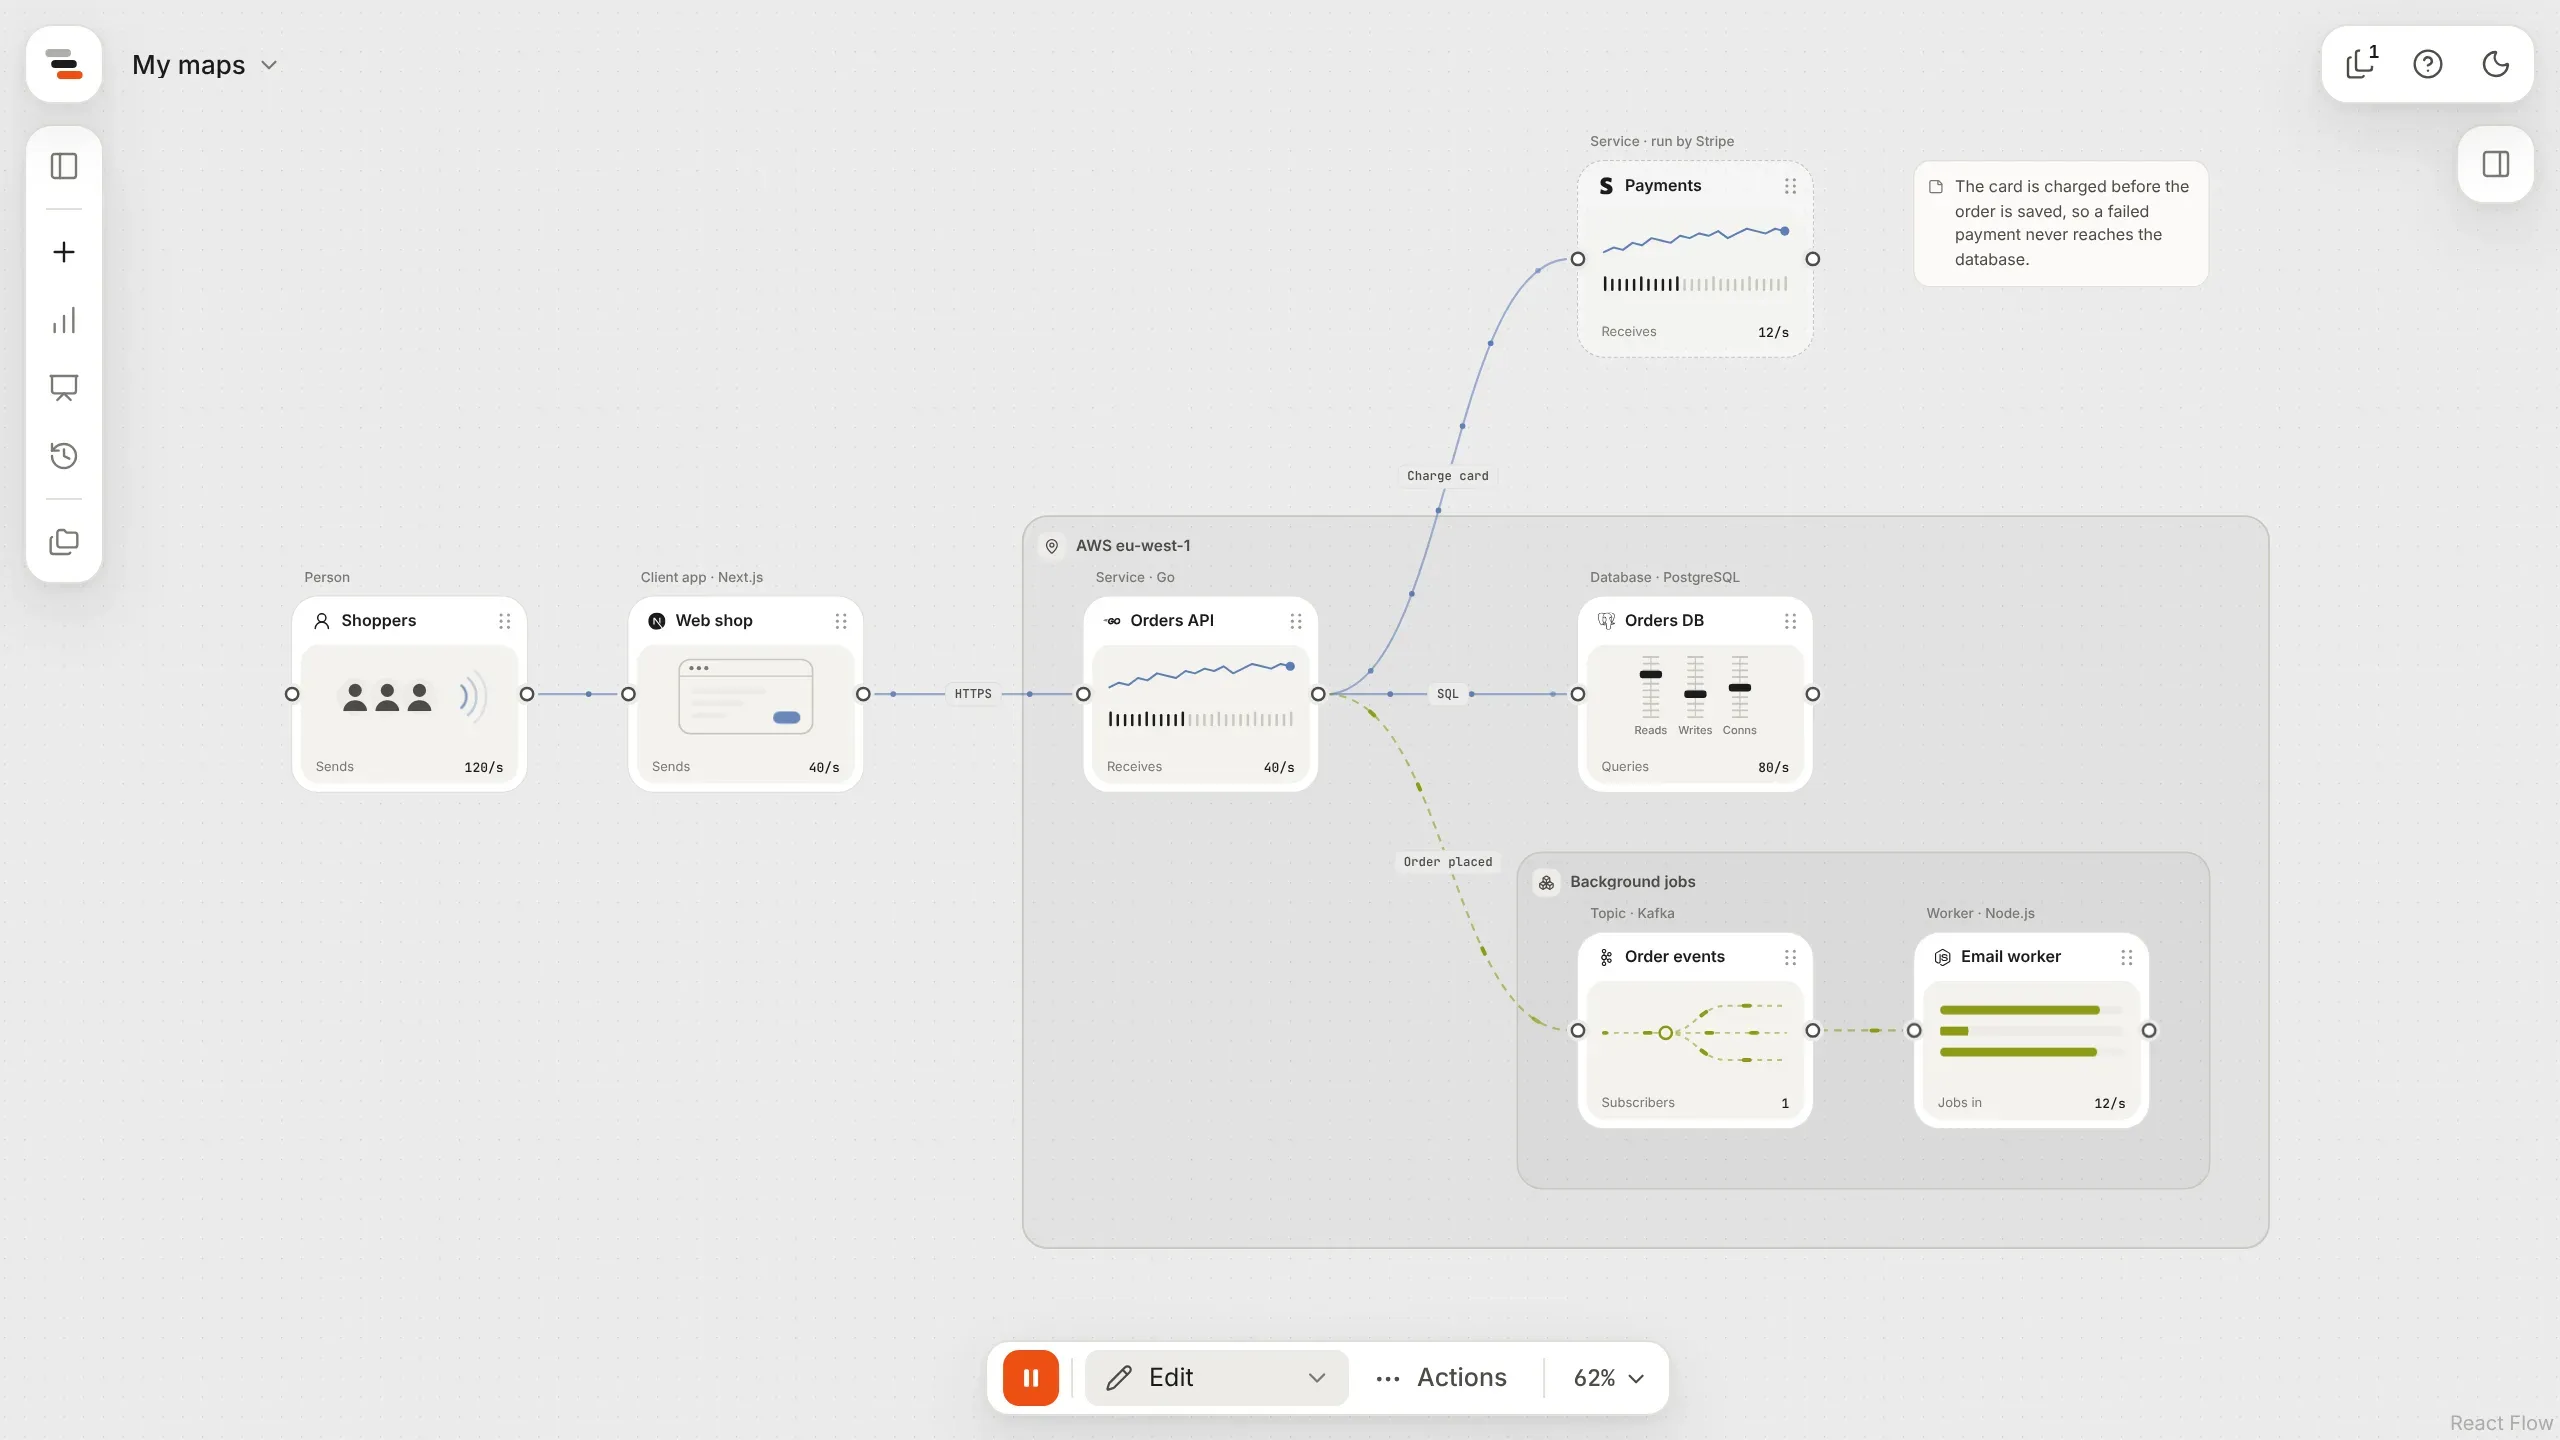
Flozu is a canvas for mapping how systems connect. You draw your infrastructure (the parts, how they connect and what flows between them) and Flozu brings it to life: traffic moves along the lines, and each part shows when it’s busy, backing up or turning traffic away.
Who it’s for
Section titled “Who it’s for”Flozu is made for tech companies that want to explain their own systems:
- To clients, who should see your rates and limits but not change anything.
- To new developers, who need to know what talks to what before they read any code.
- To people who aren’t technical, who want to know why the site slowed down on Black Friday.
- To yourself, before a launch, to find the part that runs out of room first.
What makes a map more than a diagram
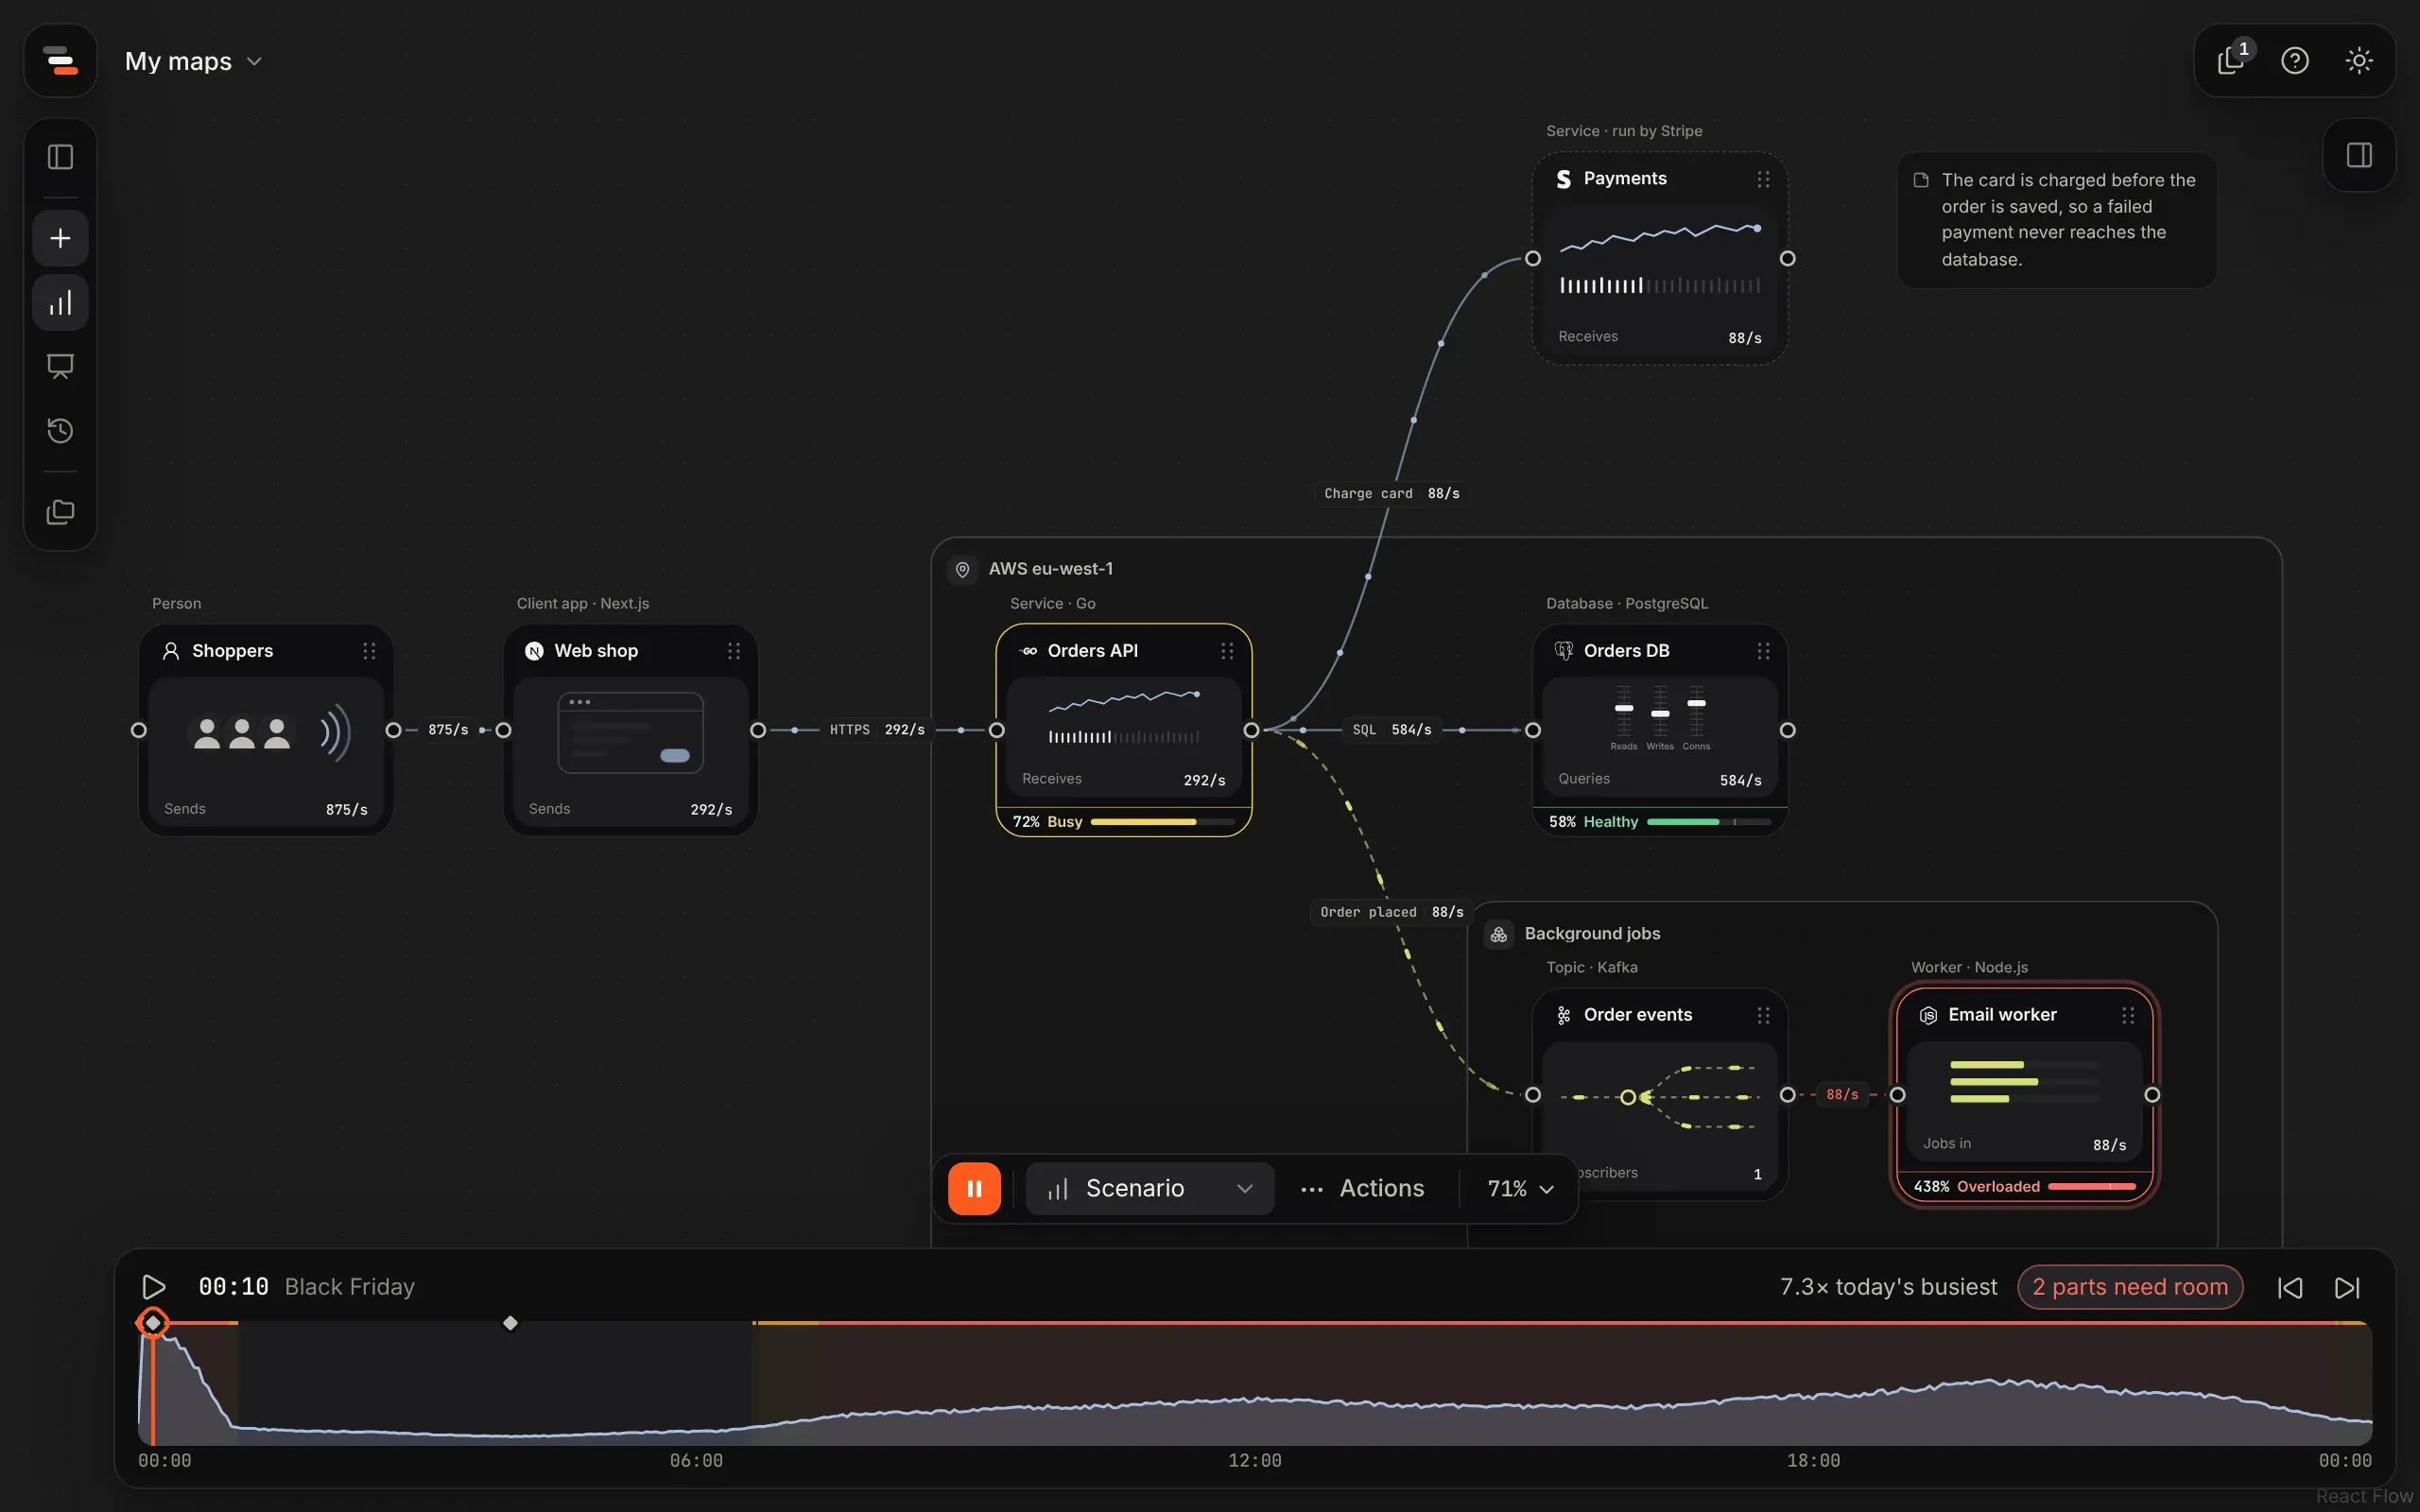
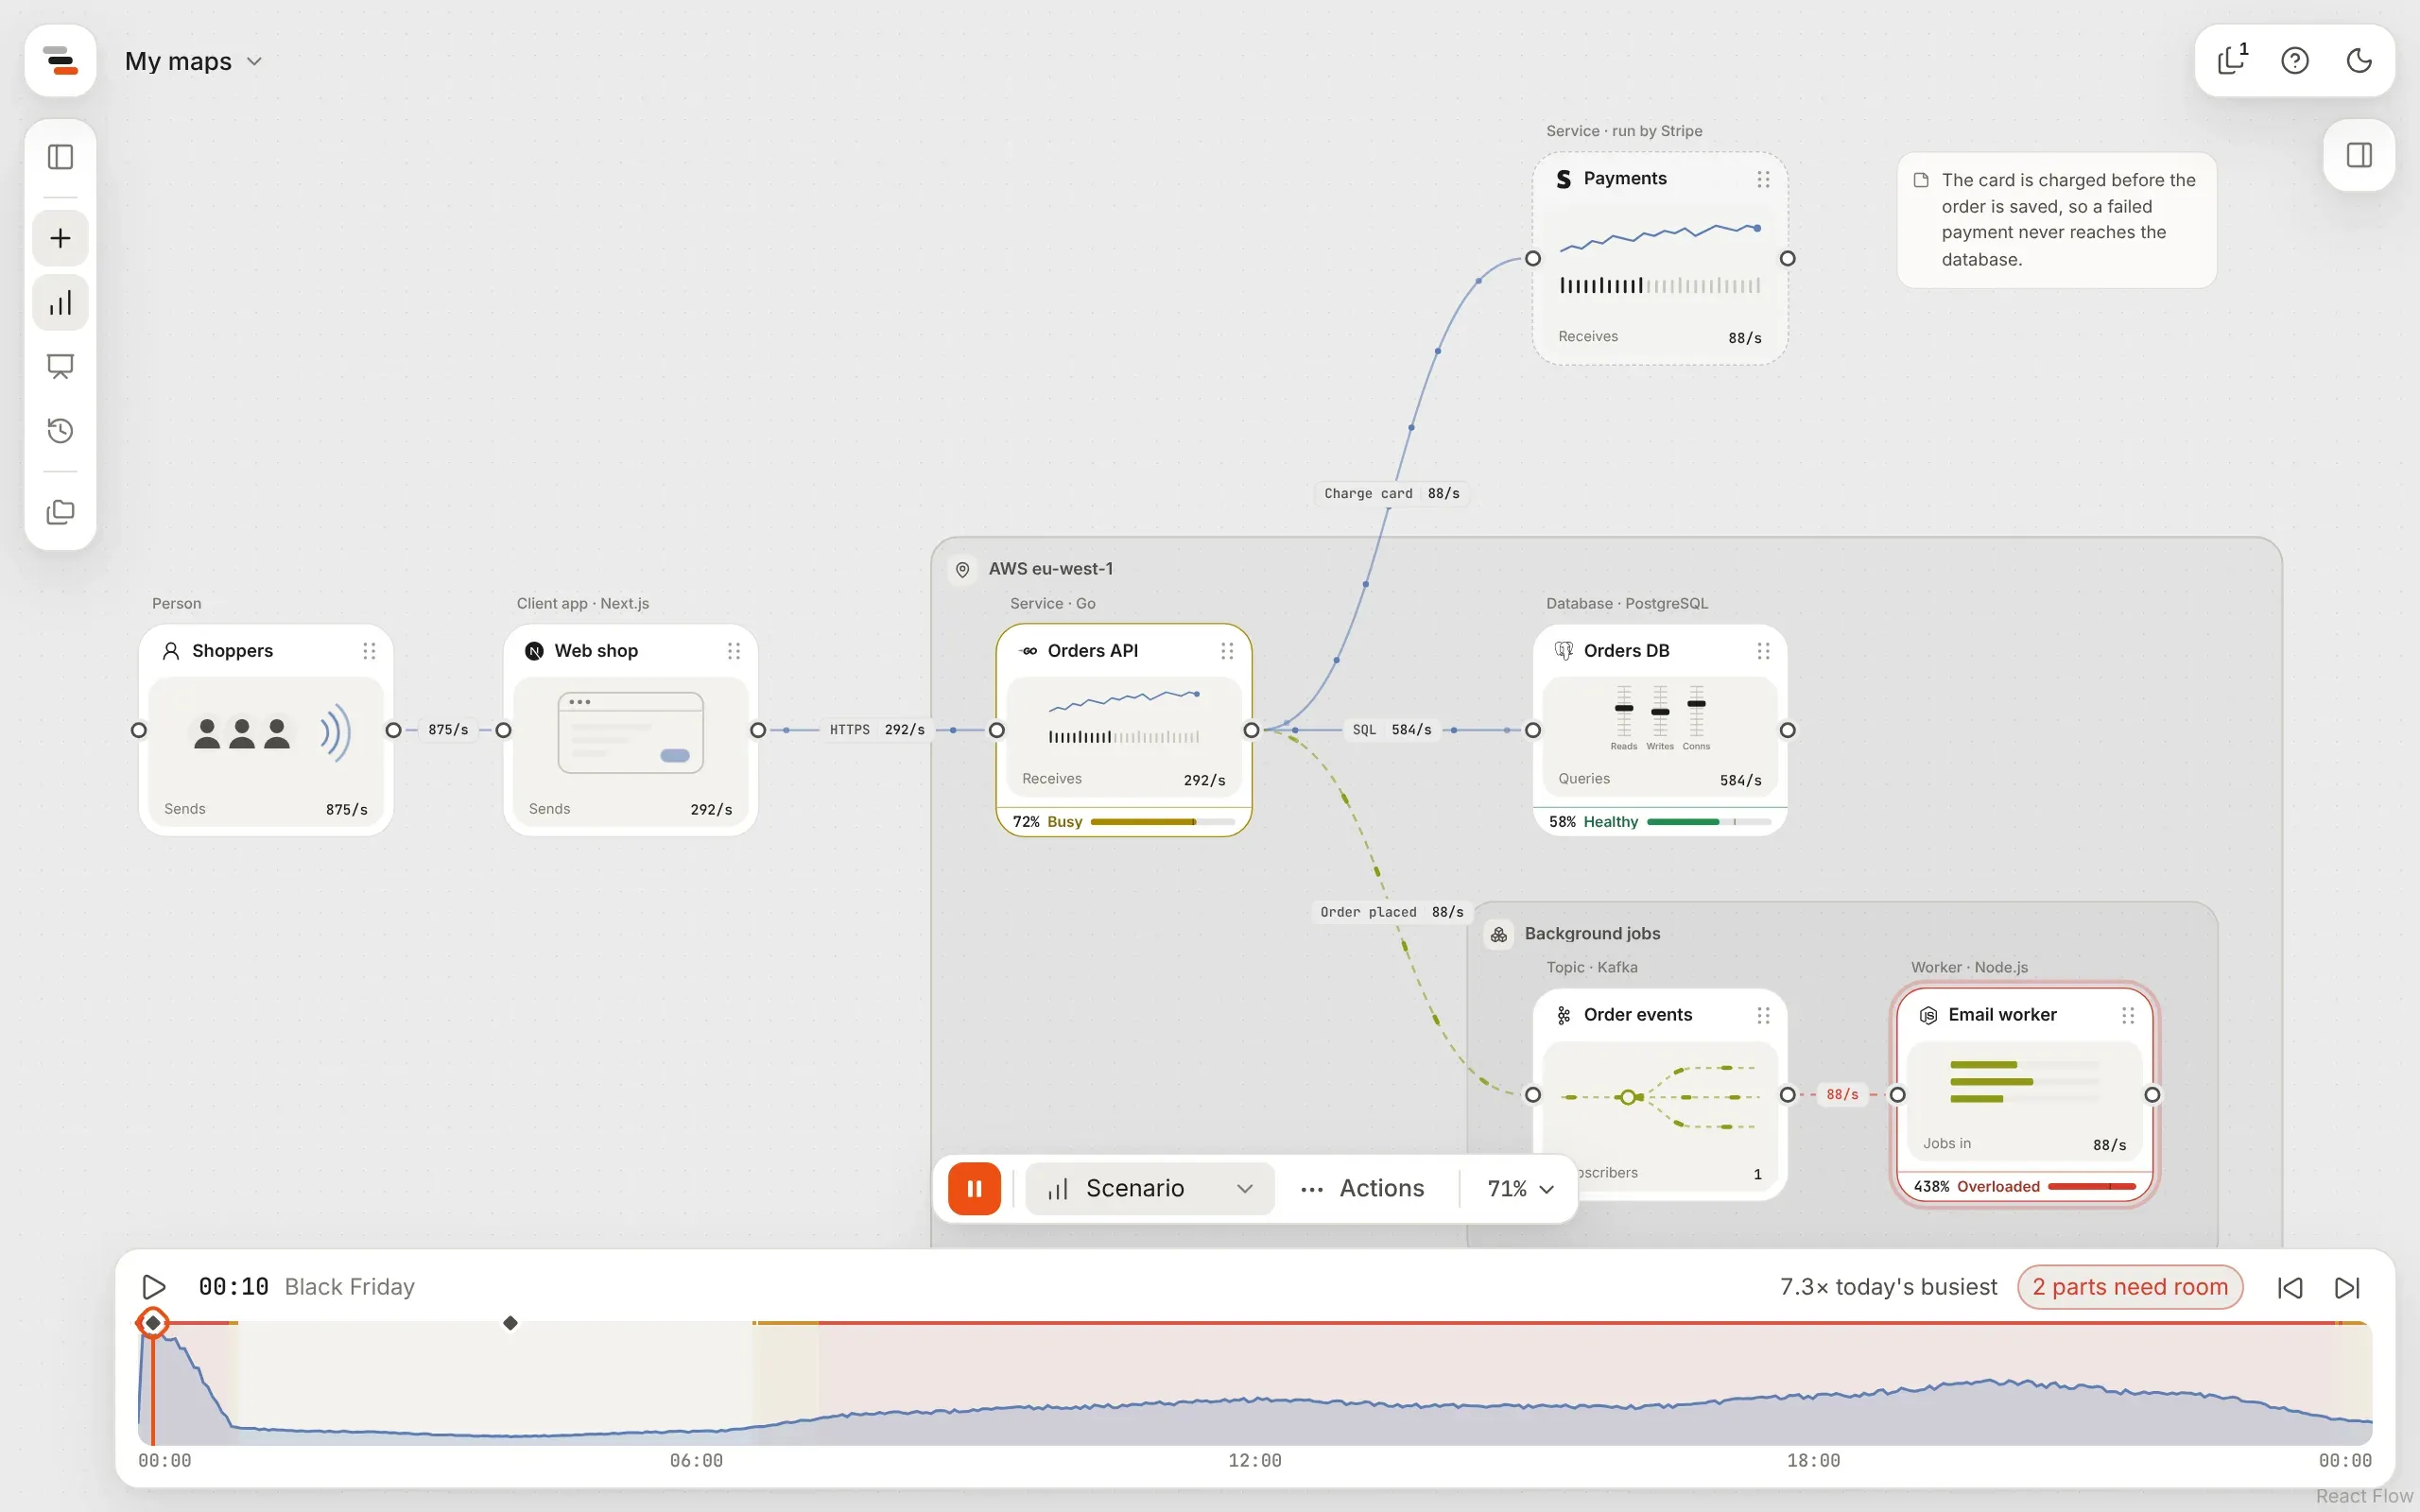
Section titled “What makes a map more than a diagram”A diagram shows boxes and arrows. A Flozu map also knows the numbers behind them: how much traffic each line carries, and how much each part can take. Say your orders API handles 400 orders a second and gets 40 on a normal day. On Black Friday it gets about 290: Flozu marks it tight, and says how much more room it needs.
From those numbers it can:
- Show the map live. Dots travel along each line, closer together on busier ones, and each part’s panel moves with what it does.
- Test a scenario. Play Black Friday over a whole day and see which part is the first to run short, for how long, and what would fix it.
- Pull the plug. Take a part or a whole region down in a scenario, and see what fails, what takes over and how many people notice. See failure drills.
- Tell a story. Walk people through the map one step at a time, each step framing the parts it’s about, with the load at that moment.
- Zoom into a part. Give a service a map of its own, its modules and what they call, and open it from the card, so a set of maps reads as one picture.
Flozu never runs your systems or reads from them. The motion comes from the numbers on the map, so it works the same on a laptop with no connection as it does in front of a client.
How it’s put together
Section titled “How it’s put together”Everything you draw is one map: parts, the lines between them, zones around them and notes beside them. Maps are saved in your account, where your team can open them too, or in your browser as a guest, or as files in the Mac app. To move maps somewhere else, export them as a file, a whole project at a time if you like, or as a picture for a slide. To show it to someone, share a link that carries the map inside it.