

Response times and cost
A fix that stops an outage is easy to want. The question that follows is always “what will it cost, and will it slow anything down?” While a scenario plays, Flozu estimates three things to answer it: how long requests take where traffic starts, how much of that traffic fails, and what the map costs to run.
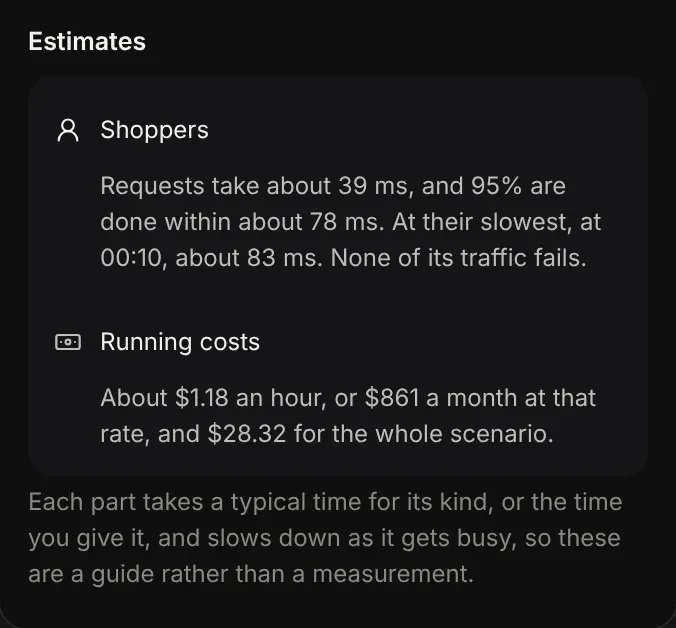
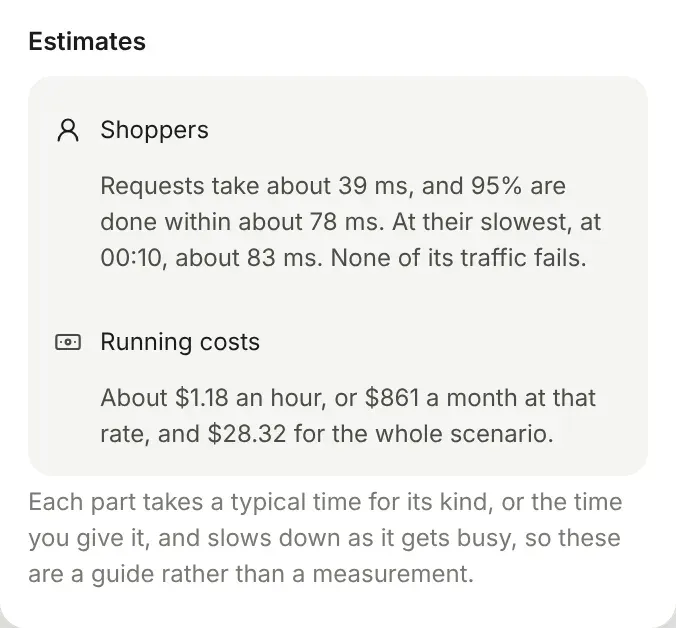
On the Checkout system map on Black Friday, shoppers’ requests take about 39 ms, and 95% are done within about 78 ms. Give its parts running costs, as Make the case for a fix does, try a standby region for Region down, and the comparison says: “After, nobody notices, for about $1,241 a month more.” That’s a decision you can take to your team.
These are estimates, worked out from the map by fixed rules, so they’re a guide for comparing one design with another rather than a measurement.
What the estimates say
Section titled “What the estimates say”Estimates, under Time and cost in What happens, lists each part where traffic starts, such as your shoppers, with:
- How long requests take, typically, and the time 95% of them are done within. It adds the slowest moment when that’s well past the rest, or when some requests time out.
- How much of its traffic fails, across the scenario and at its worst. That’s everything a failure breaks, what a limit or a full buffer turns away, and what waits so long it times out.
Then Running costs, once a part has a cost: what the map costs an hour on average, a month at that rate, and for the whole scenario, and an hour at its dearest moment. Select it to see the parts that cost something, at that moment.
Hover over a part’s health strip on the canvas to see roughly how long it takes at the playhead, such as “about 140 ms each”.
Give a part its time and cost
Section titled “Give a part its time and cost”Select a part and open its Traffic tab:
| Field | What it sets |
|---|---|
| Takes | How long it takes to handle one request while it has room, in milliseconds. Left empty, it takes a typical time for its kind, shown in the field. |
| Costs | What it costs to run for an hour, in dollars. For a part that auto-scales, what one copy costs, and a scenario adds up the copies it runs. |
A queue or topic only holds work, so it has a cost but no time. People and apps where traffic starts have neither.
Typical times
Section titled “Typical times”A part with no time of its own takes the typical time for its kind:
| Part | Takes | A new copy starts in |
|---|---|---|
| DNS | 20 ms | None |
| CDN | 20 ms | None |
| Firewall | 2 ms | 60 s |
| Gateway | 5 ms | 60 s |
| Sign-in | 100 ms | 2 min |
| Load balancer | 1 ms | 60 s |
| Rate limiter | 1 ms | 30 s |
| Service | 50 ms | 90 s |
| Worker | 500 ms | 90 s |
| Function | 100 ms | 2 s |
| Scheduler | None | 60 s |
| AI model | 2 s | 5 min |
| Queue | 5 ms | 2 min |
| Topic | 5 ms | 2 min |
| Database | 10 ms | 10 min |
| Cache | 1 ms | 5 min |
| Search | 50 ms | 10 min |
| Storage | 50 ms | 60 s |
| Data warehouse | 2 s | 2 min |
| Endpoint | 50 ms | 90 s |
| Module | 10 ms | 90 s |
| Code file | 5 ms | 90 s |
| Table | 5 ms | 10 min |
| Custom part | 50 ms | 2 min |
See what a fix costs
Section titled “See what a fix costs”Fixes come with what they cost, where the parts have one:
- Time and cost advice says what keeping more copies warm costs a month, or what letting a part scale in saves.
- On the Compare screen, the verdict adds the change in cost, such as “After, nobody notices, for about $310 a month more”. Below it, Requests take, typically shows where requests got faster or slower, where none of them fail on either map, and Running costs what each map costs a month at that rate.