

Scenarios
Your orders API copes fine today. Will it on Black Friday, when seven times as many people show up at midnight? A scenario plays that day on your map and shows you the answer before your customers find it: which parts run short or fail, when, for how long, and what would fix them.
A scenario can be a busy day, a TV ad that sends everyone at once, a launch, steady growth, or something breaking. Flozu has 9 ready-made ones, and you can make your own.
Try it
Section titled “Try it”On the Checkout system template:
-
Open Scenarios in the map’s menu and pick Black Friday. A timeline appears along the bottom, and the map shows the busiest moment, ten past midnight.
-
Read the card at the top of What happens: 2 of 3 parts need room, the busiest at 438%.
-
On the canvas, the Email worker is outlined in red. About 88 emails a second reach it, and it can send 20.
-
Under Fix it, Flozu says to give it 126 a second, or run 7 copies. Select Apply, and the red outline goes.
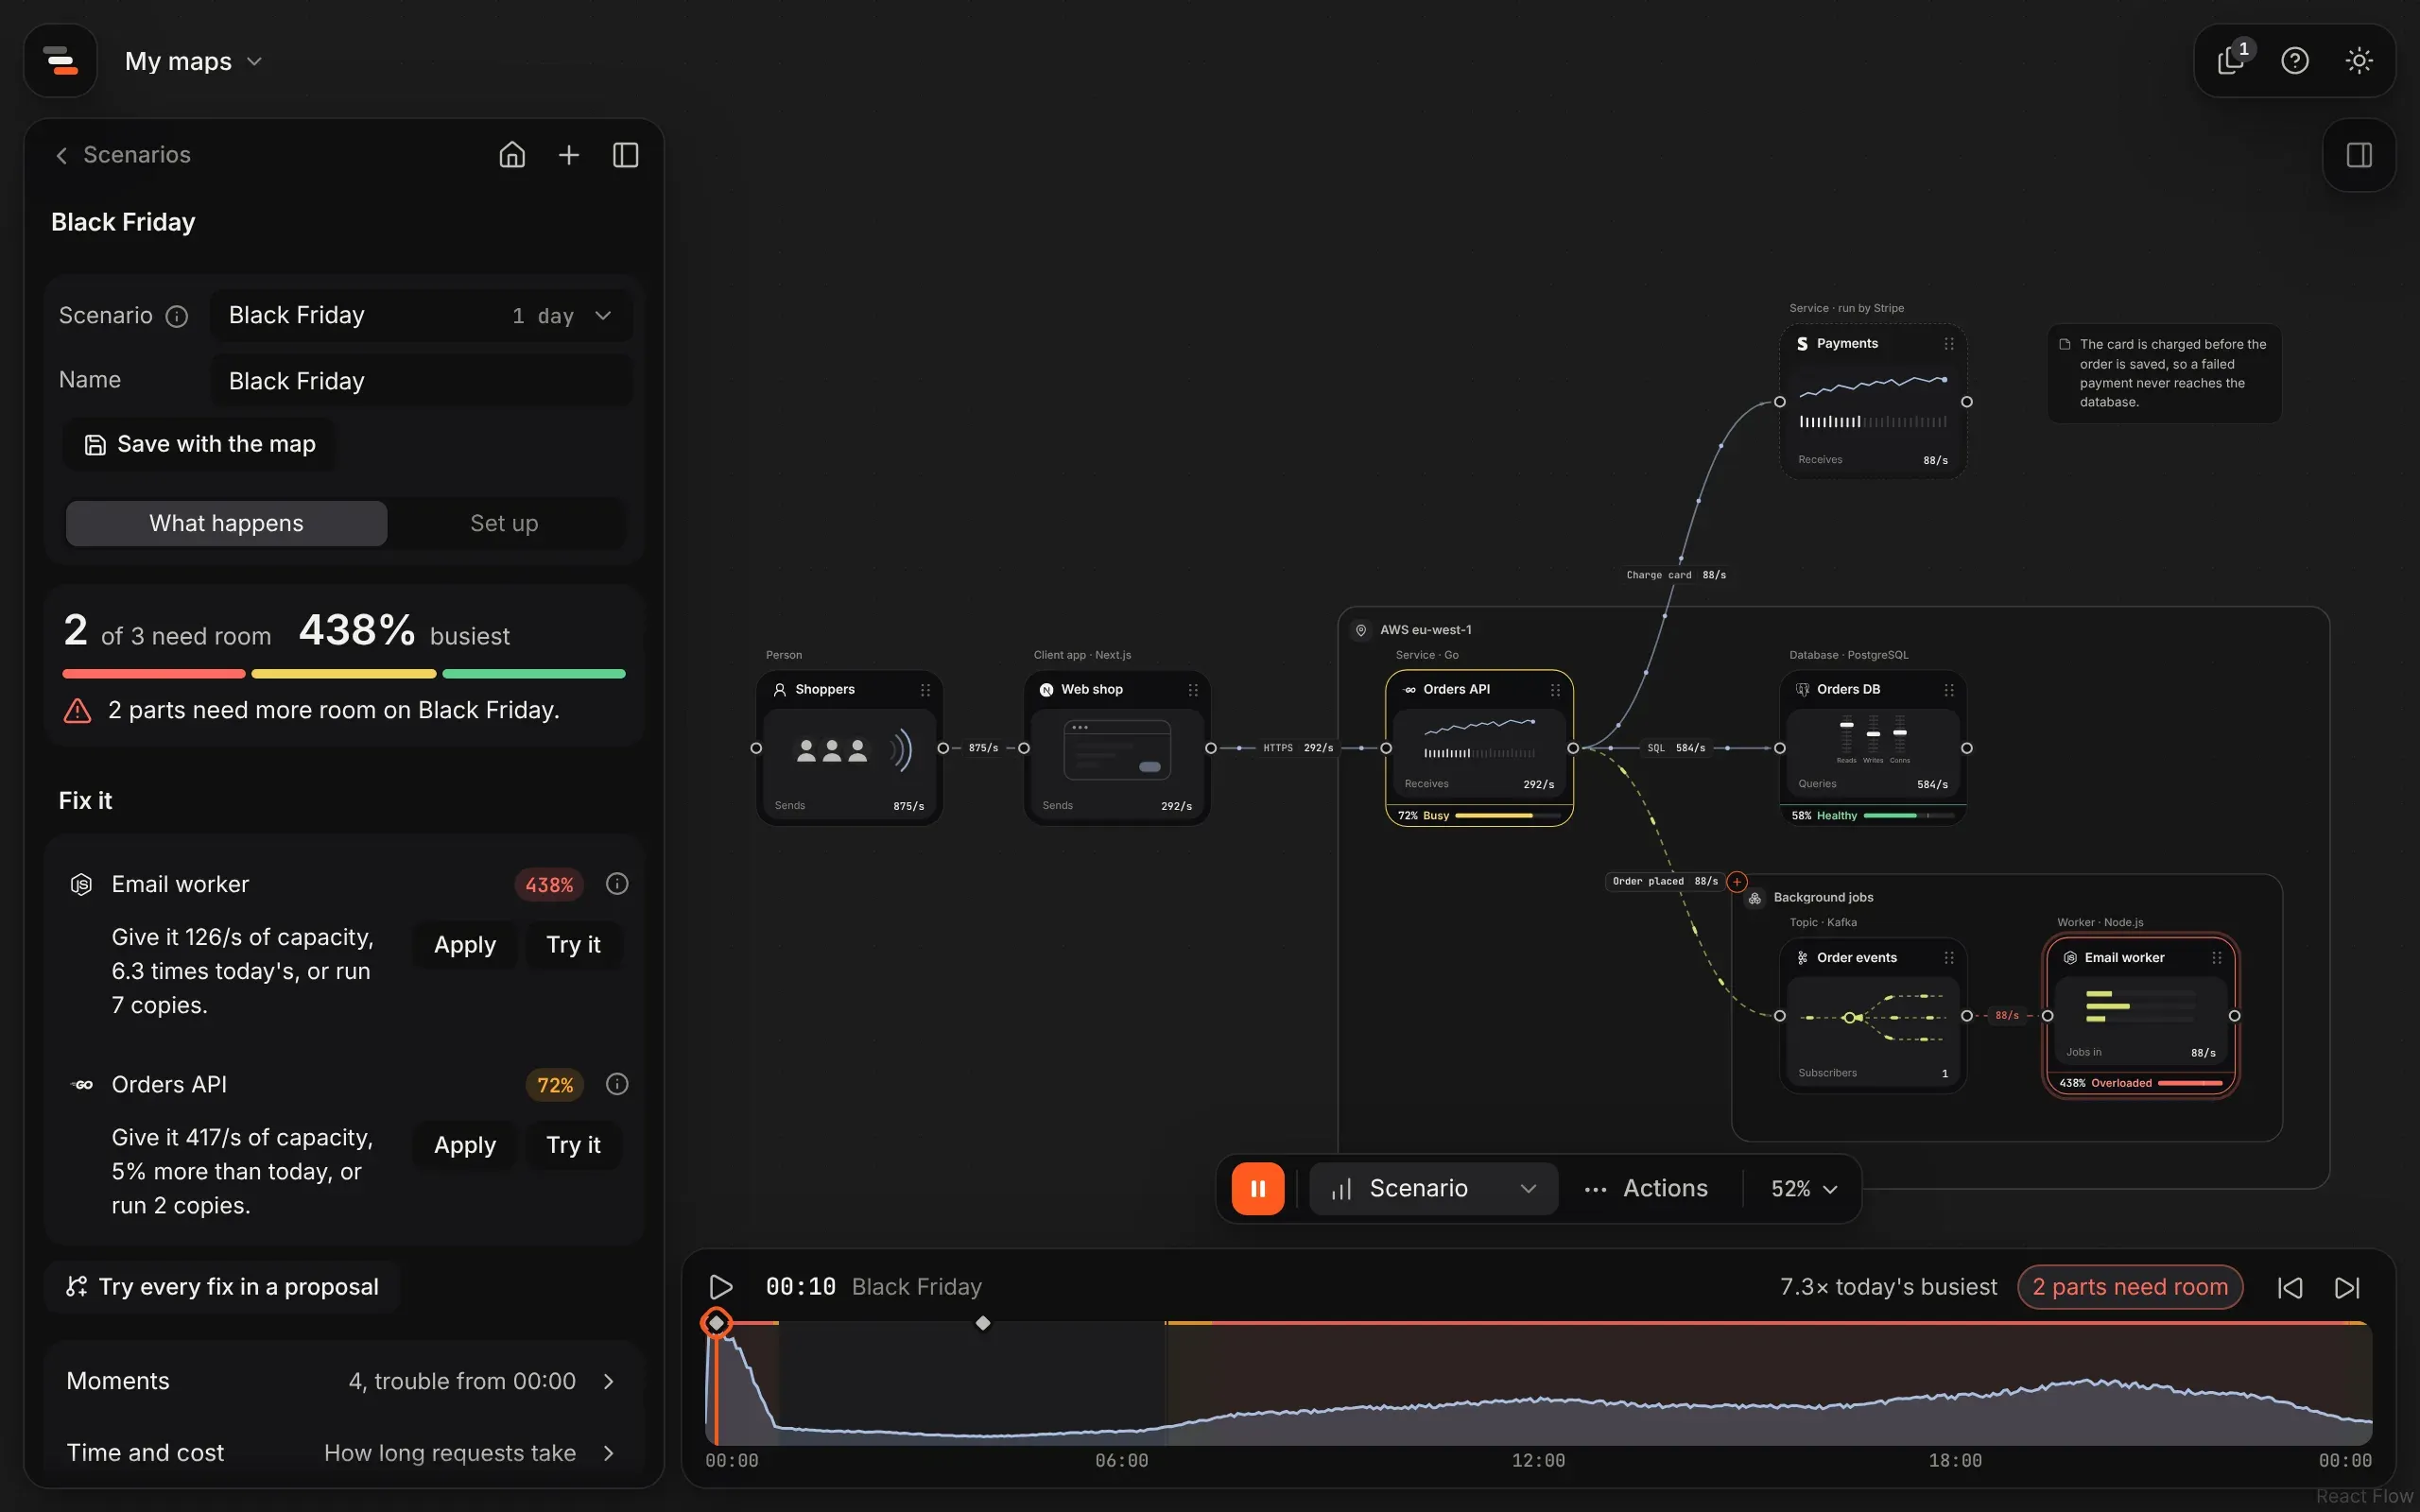
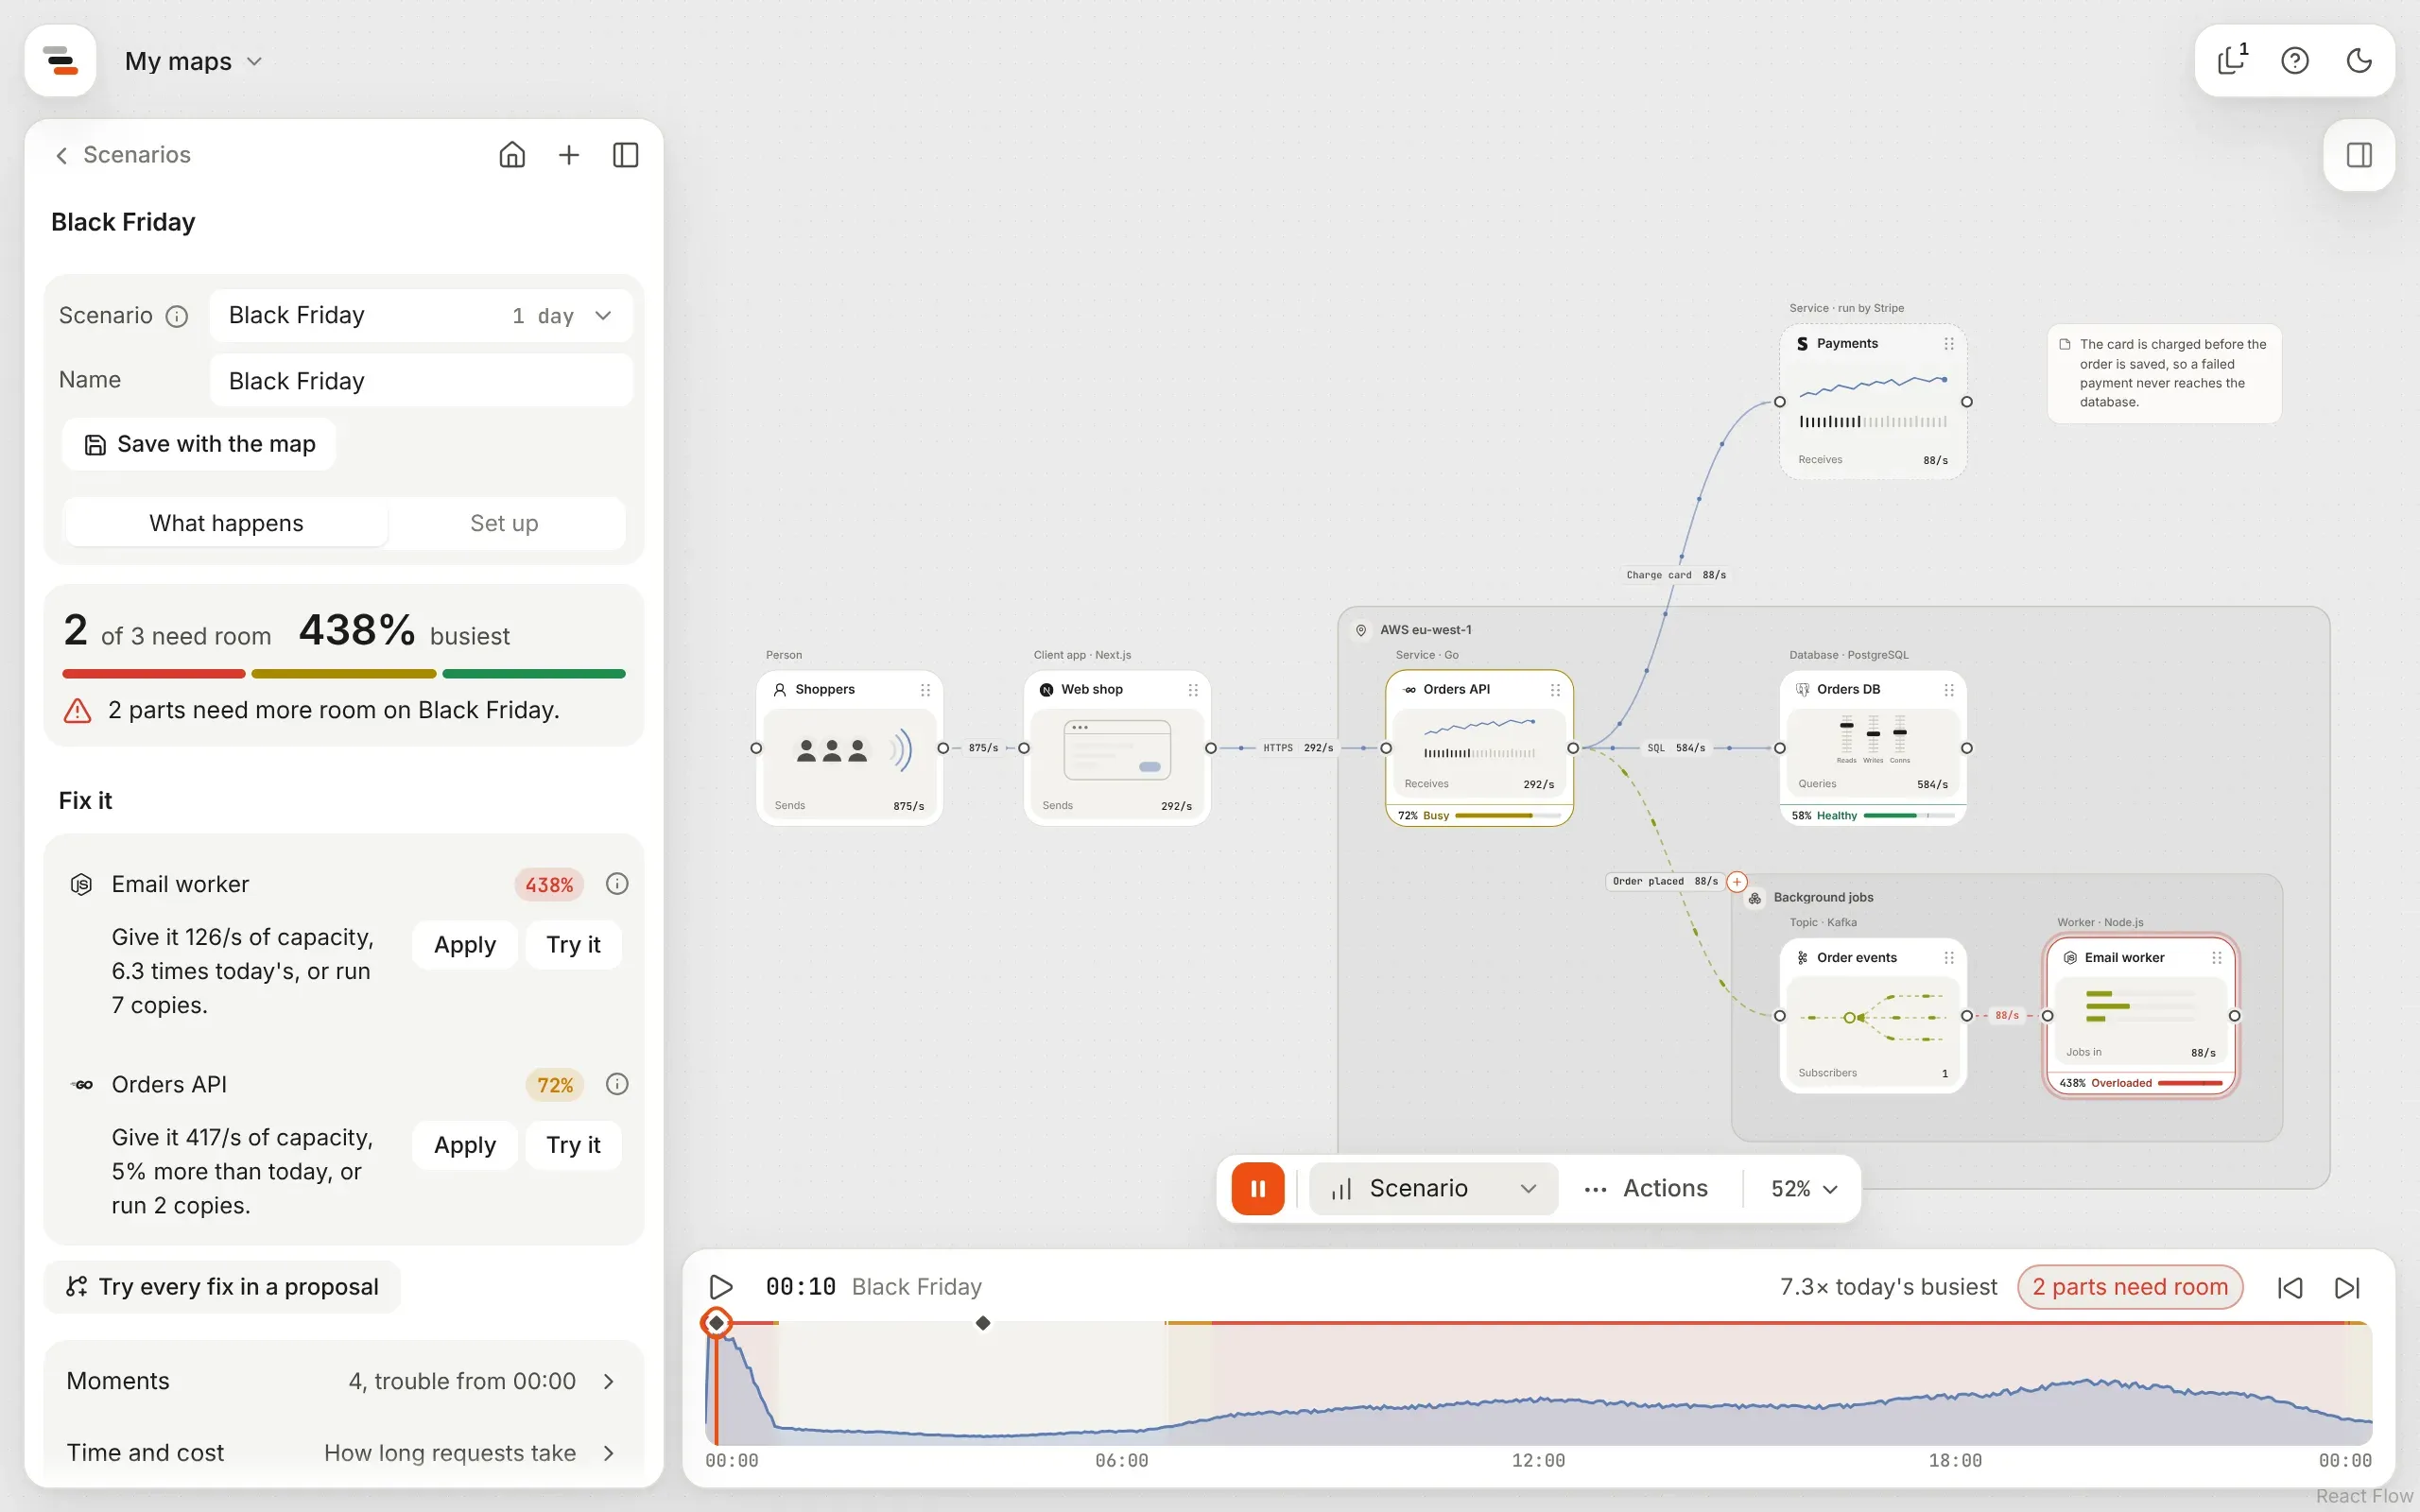
Will it survive Black Friday? walks through the same thing with every number explained.
Pick a scenario
Section titled “Pick a scenario”Scenarios lists the map’s own saved scenarios under On this map, then the ready-made ones, such as Normal day, Black Friday, Product launch, Back after an outage and Region down. See ready-made scenarios for what each one does. Scenario at the top of the panel switches to another without going back to the list. Choosing Scenario in the mode menu at the foot of the canvas goes straight in.
To end a scenario, choose another mode or close the panel.
Read what happens
Section titled “Read what happens”The What happens tab opens on the outcome: how many parts need room and the busiest one’s share in big numbers, a bar with a segment for each part coloured by how it copes, and a sentence, such as “2 parts need more room on Black Friday”. Under it, Fix it lists the first three fixes.
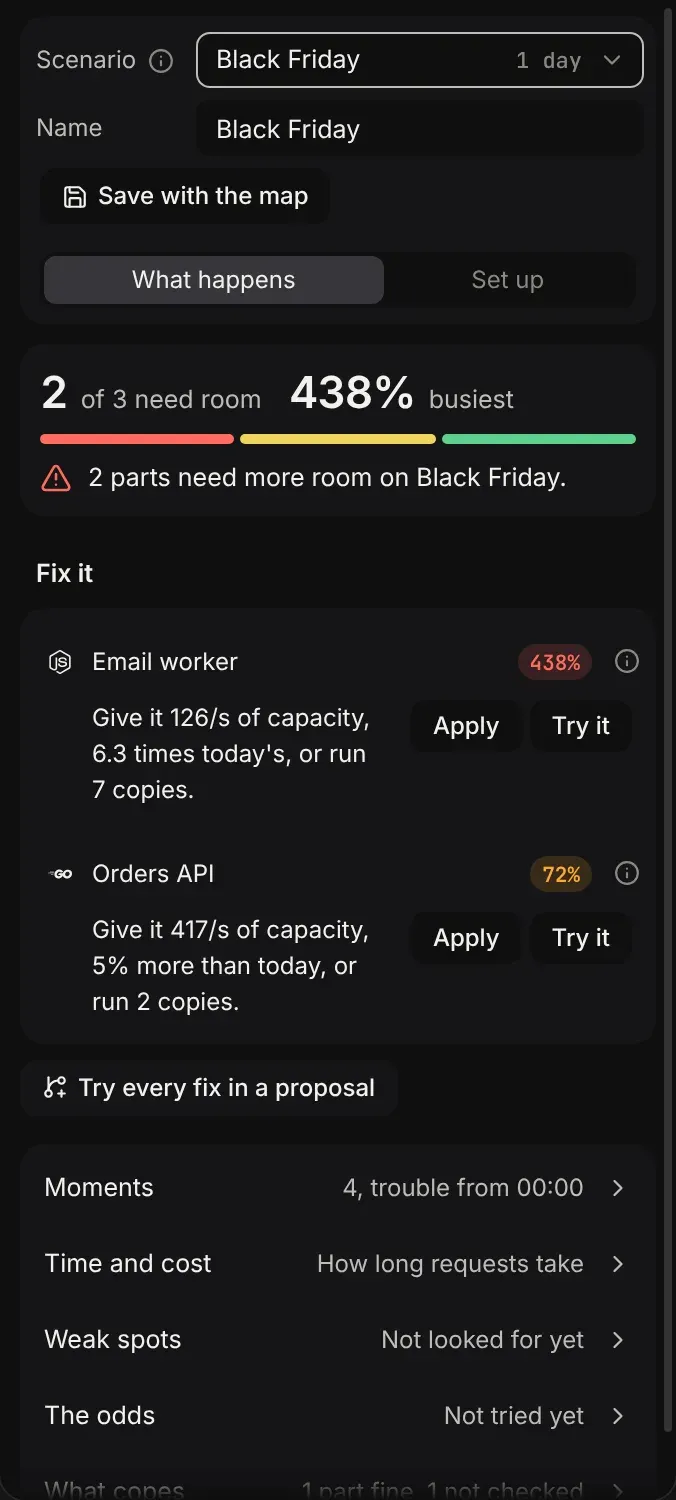
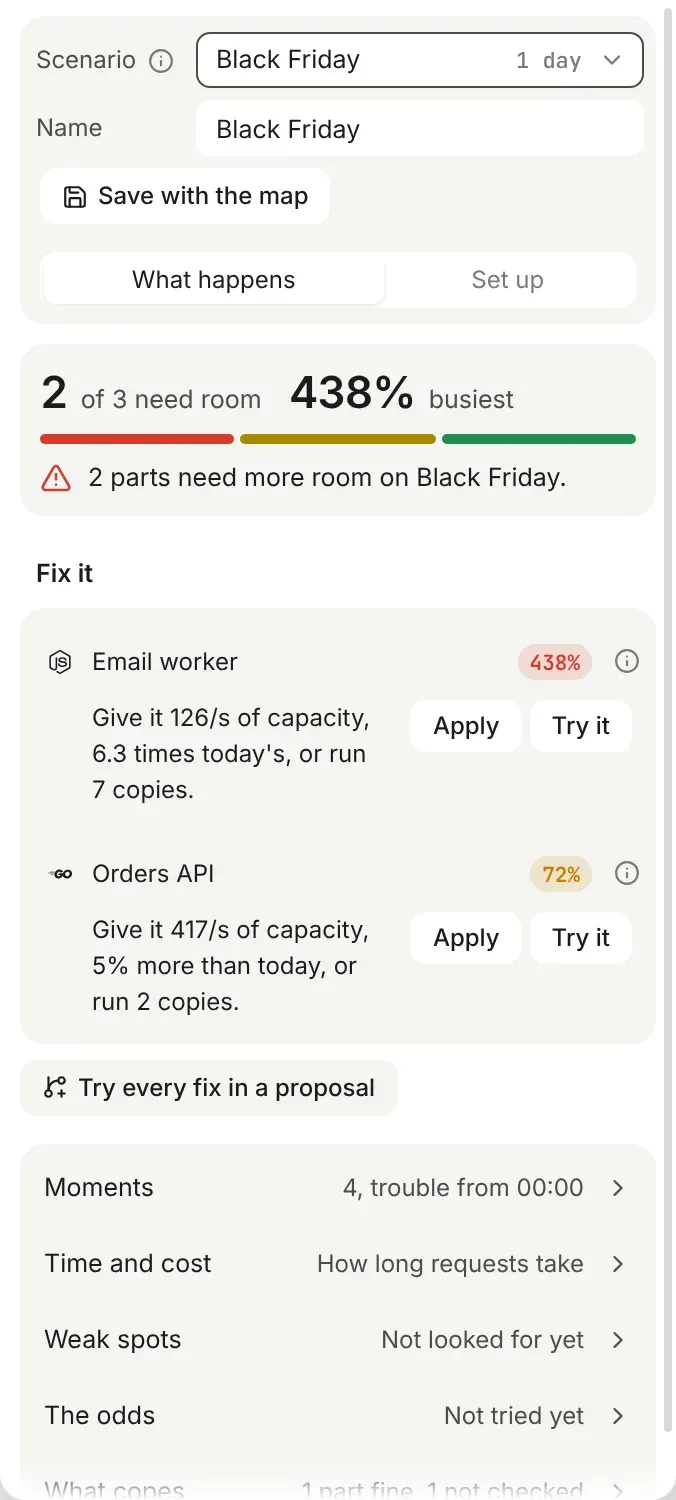
Below that, each row has a headline, such as “4, trouble from 00:00” for Moments. Select a row to go in to it, and the way back at the top to come out. What you find in a row stays there while you look at something else.
| Row | What it tells you |
|---|---|
| Every fix | Every fix, when there are more than three. |
| Moments | The busiest and quietest moments, and when each part first gets tight, runs over, turns traffic away or fills its buffer. Select one to move the timeline there. |
| Needs more room | Each part that’s ever short, worst first, at its own worst moment, with the fix sized for that moment, such as “Give it 126/s of capacity, 6.3 times today’s, or run 7 copies”. The i beside it says for how long and from when. |
| Time and cost | Keep more copies running, let a part scale in, or make a part smaller when even its busiest moment uses under 30% of it. And estimates of how long requests take and what the map costs. |
| Blast radius and Survive it | For a scenario where something fails: what each failure touched, and what would carry on next time. See failure drills. |
| Weak spots | Find weak spots takes each part and zone down in turn at the busiest moment, and lists the ones that hurt most. |
| The odds | For a scenario with random spikes: how often each part runs short over many runs. See the odds. |
| What copes | The parts with room to spare, and the ones with no capacity set. |
Select a part in the panel to select it on the canvas and move the timeline to its worst moment.
Fix what it finds
Section titled “Fix what it finds”Each fix has two buttons:
- Apply makes the fix on the map as one change, so one undo takes it back.
- Try it makes it in a proposal instead: a copy of the map you can compare with the original, with the same scenario playing on both. The map itself doesn’t change until you adopt it.
With more than one fix, Try every fix in a proposal makes them all in one, called “Cope with Black Friday”. A fix that changes the map’s shape, such as a standby copy, always starts as a proposal.
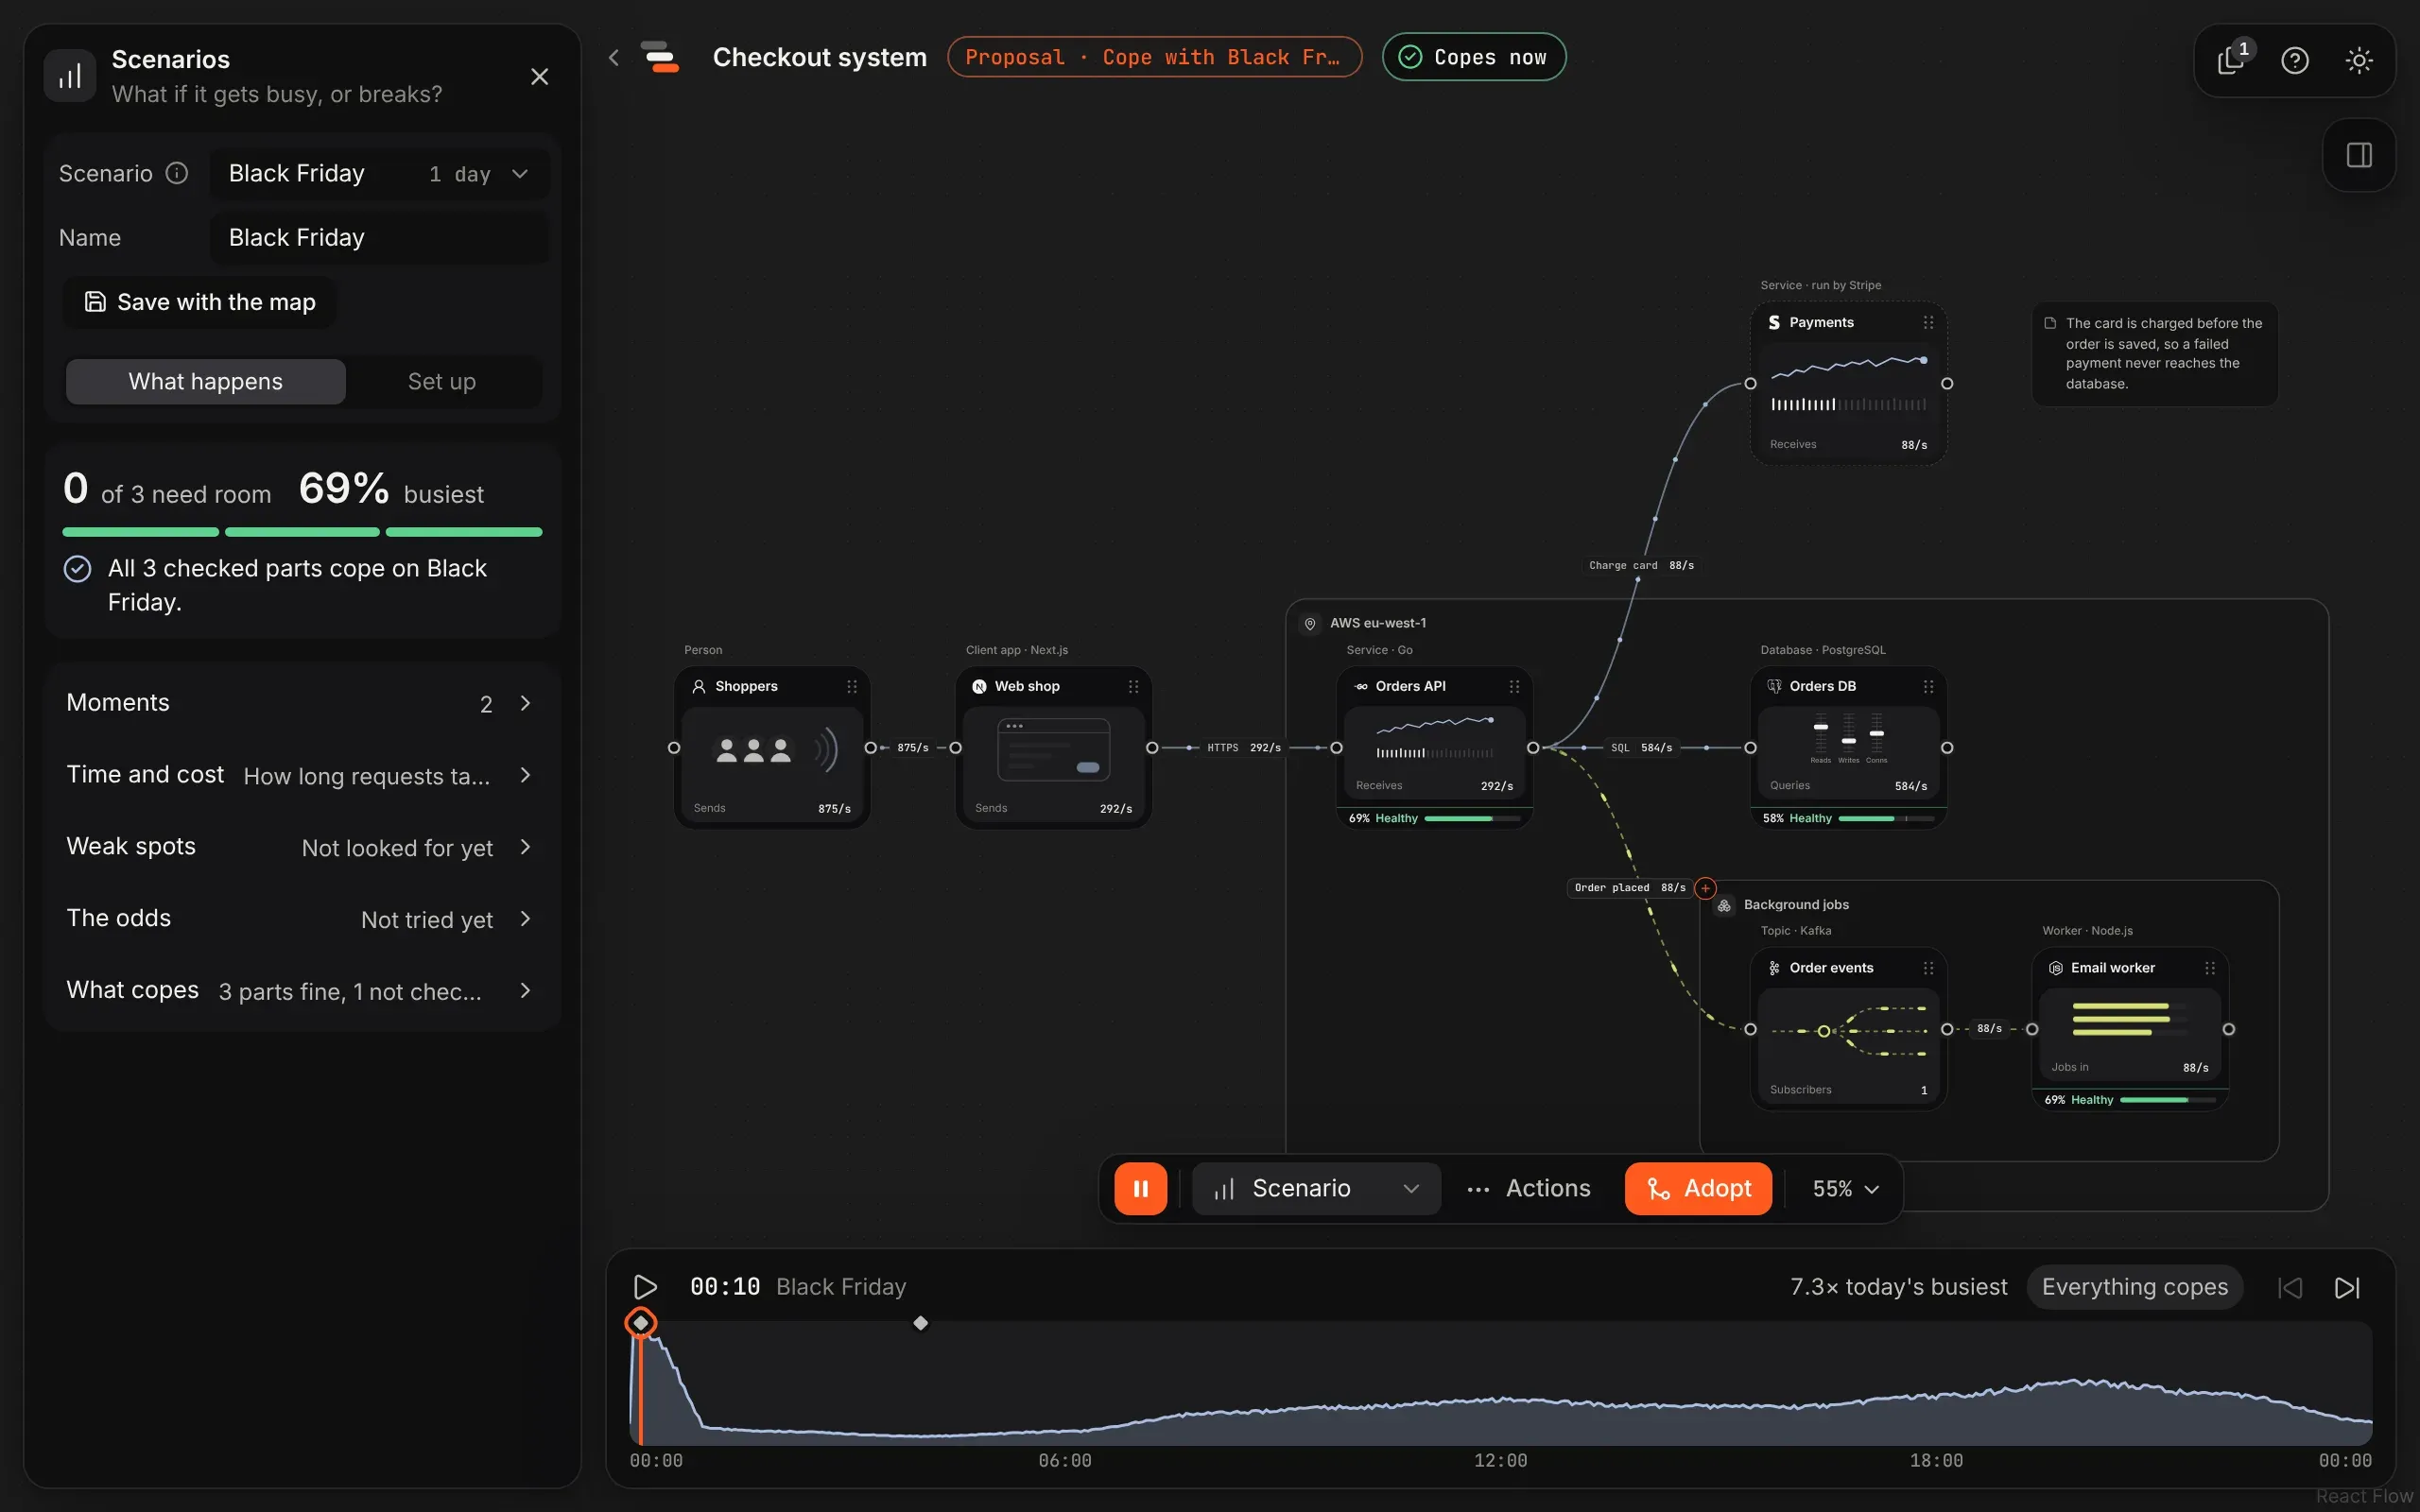
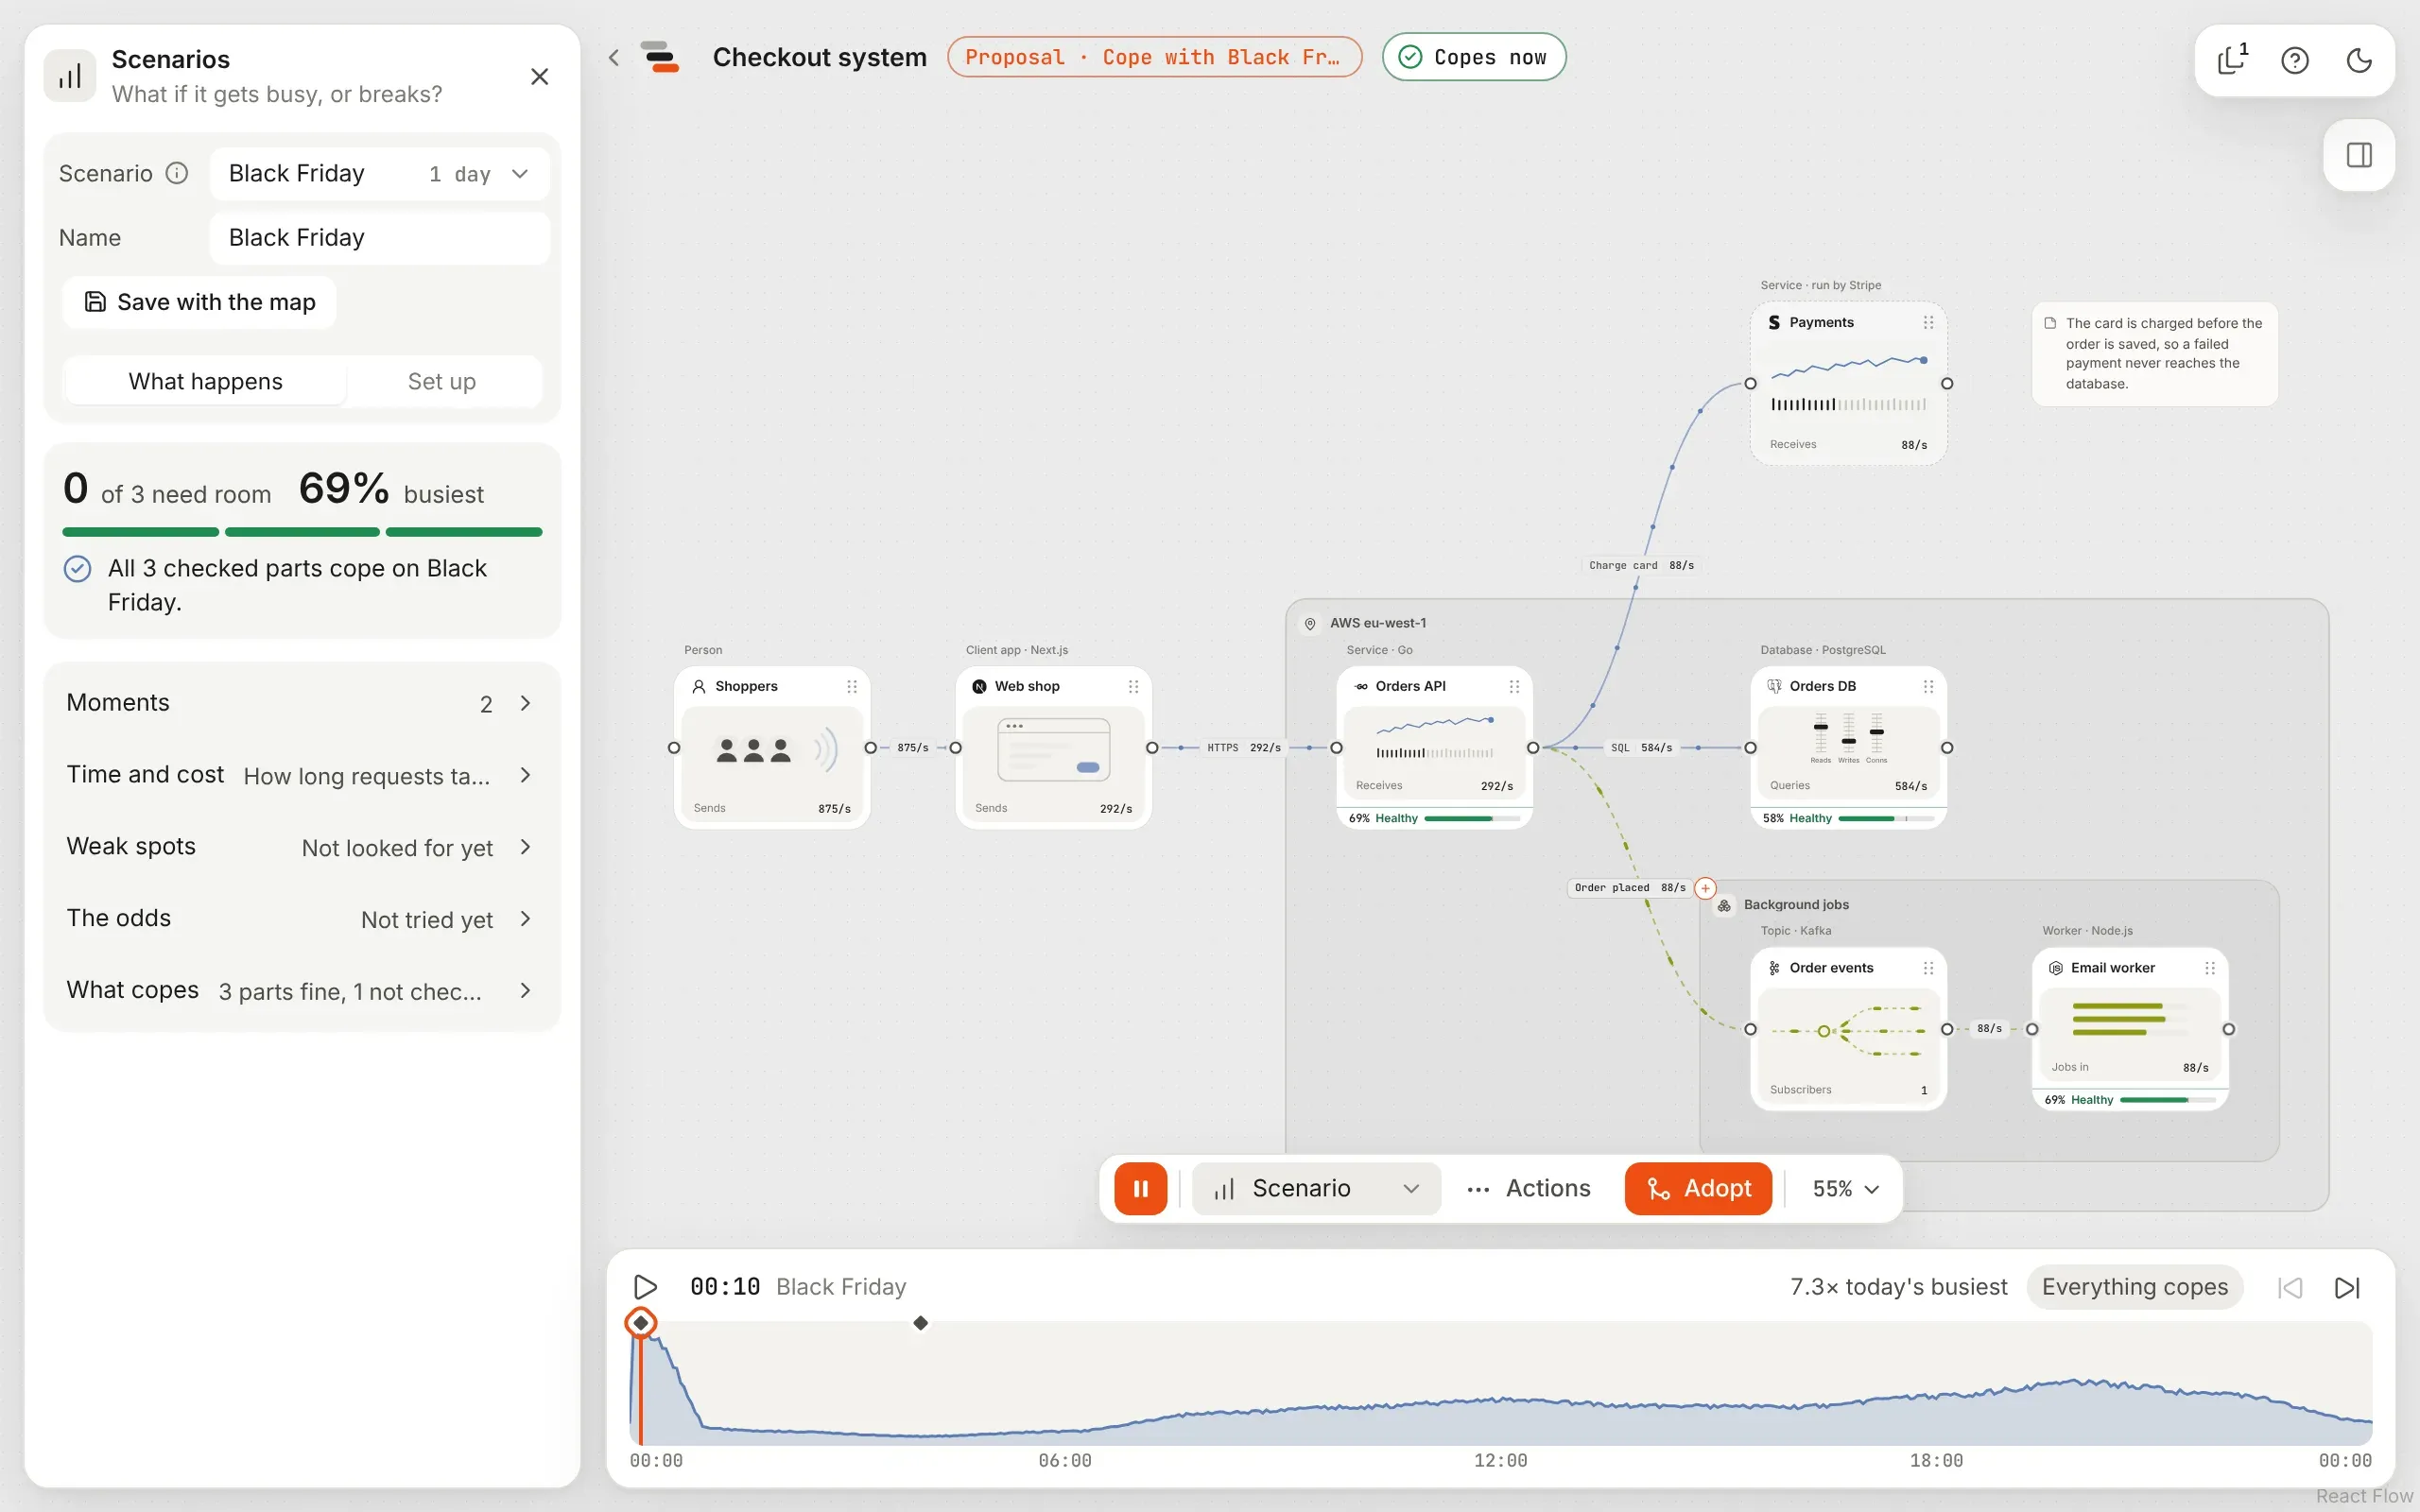
The scenario plays on the map as it stands, so changing a capacity in the inspector shows on the canvas straight away.
On the canvas
Section titled “On the canvas”While a scenario runs, the canvas shows the moment at the timeline’s playhead:
- Each line’s dots move at its rate then, and its label says the rate.
- Each card’s figure counts the traffic then.
- A part with a capacity or a limit has a health strip along the bottom of its card: how busy it is, as a share of what it can take, and a meter with a tick at the spare room to keep. Hover the strip to read it all in words.
- Busy, critical and over parts are outlined in their colour, and an over part breathes. The lines into it turn red and slow down, as the work backs up.
| Health | When | Colour |
|---|---|---|
| Underused | Under 30% busy, or under the spare room if that’s less. | Blue |
| Healthy | Between underused and the spare room. | Green |
| Busy | Past the spare room, 70% busy by default. | Yellow |
| Critical | Past 90%, or past the spare room if that’s higher. | Orange |
| Over | Past its capacity: Overloaded, Queueing when work backs up, or Turning away when its limit refuses traffic. | Red |
| Down | A failure took it down, so nothing gets through. Its card fades behind a dashed outline. | Red |
A part that fails some of its traffic, because something after it is down, adds the share that fails to its strip, such as “33% fail”.
The timeline
Section titled “The timeline”The timeline along the bottom draws how many people are online (or the multiple of today) across the scenario. An amber line along its top marks where a part is tight, a red one where it’s over, and diamonds mark the moments worth stopping at. The header says the time, the scenario, how busy it is then as a multiple of today’s busiest, and whether everything copes.


It opens at the scenario’s worst moment. To move through it:
- Drag along it, or click anywhere on it.
- Use the arrow keys for small steps, Shift with the arrows for bigger ones, and Home and End for the start and the end. Space plays and pauses.
- Skip to the previous or next moment with the buttons on the right.
- Play it through in about 30 seconds. The canvas follows the playhead.
In a failure drill, each failure has a bar along the foot of the graph, red for down and dashed amber for degraded, the stretch where traffic fails is shaded red, and the header says what’s wrong, such as “4 parts down, 33% failing”.
Moments
Section titled “Moments”The moments marked on the timeline are the ones Moments lists, and a story step can stop at any of them:
| Moment | When |
|---|---|
| The busiest moment | Traffic at its highest. |
| The quietest moment | Traffic at its lowest. |
| Part gets tight | That part first runs past its spare room. |
| Part runs over | That part first runs past its capacity. |
| Part turns traffic away | That part first turns traffic away at its limit. |
| Part’s buffer fills | That queue or topic first fills up. |
| Part goes down | A failure takes it down, or a zone or several parts. A line is cut, and a degraded one is degraded. |
| Part moves traffic over | Traffic moves off what failed, onto a standby or the lines beside it. |
| Part’s requests start failing | Some of what starts there first fails. |
| Part is back | The failure ends. |
| Everything copes again | Everything is clear again. |
Make your own
Section titled “Make your own”The Set up tab shapes the scenario. Changing a saved or ready-made scenario turns it into a draft, shown as such in the picker.
Say you’re running a TV ad at 8pm and expect three times the usual traffic for twenty minutes. Start from Normal day, and under Events add a Spike at 20:00 to a level of 3, holding for 20 minutes. Play it, and What happens says whether you’re ready.
People online
Section titled “People online”For each part where traffic starts, how many people use it at once on a normal day: at the busiest moment, at a typical one and at the quietest. Leave it out and a scenario counts in multiples of today. You can also set this in the part’s Traffic tab.
Timeframe
Section titled “Timeframe”How long the scenario runs, from 10 minutes to 4 weeks; the time of day it starts; whether it follows a day’s rhythm (quietest at about 4am, busiest at about 8pm) or stays steady; and how busy it runs, as a multiple of today’s busiest moment.
Events
Section titled “Events”What happens to people over the timeframe. Each event has when it starts, its shape, and whether it reaches everyone or just one part where traffic starts, such as a push notification that only reaches the app.
| Event | What it does | For example |
|---|---|---|
| Spike | Rises to a level, holds, then falls back. | A TV ad, a newsletter, a ticket drop |
| Growth | Grows to a level over a length of time, and stays there. | A launch that keeps growing for a week |
| Outage | Nobody gets through for a while, then everyone comes back at once. | Your provider’s outage, then the rush when it’s back |
Levels are multiples of a normal day’s busiest moment, so a map of 200 people and a map of 2 million both get a sensible Black Friday. Type lengths as “90 s”, “10 min” or “2 days”.
Failures
Section titled “Failures”Take a part, a line or a whole zone down for a while, or leave it degraded with only part of what it can take. You can also right-click it on the canvas and choose Take down here. See failure drills.
Random spikes
Section titled “Random spikes”Up to how many random spikes to add, and the range of their peak, rise and hold. Wobble adds small moment-to-moment changes. A scenario always plays the same way until you choose Roll again, so you can show the same run to someone later.
Advanced
Section titled “Advanced”The spare room to keep, 30% by default (so a part aims to run at most 70% busy), and a plain steady multiple of today’s busiest for an hour.
Save a scenario
Section titled “Save a scenario”A draft belongs to this window only. Save with the map keeps it with the map, so it travels in files and share links, shows under the map in the Maps panel, and stories can use it. Changes to a saved scenario save as you make them, each one step to undo. Delete removes it from the map and keeps showing it as a draft.
The odds
Section titled “The odds”One run of a scenario with random spikes can be lucky. The odds play it many times, each with different spikes, and say how often each part runs short.
-
Open The odds, under What happens, for a scenario with random spikes or wobble.
-
Pick how many runs, from 20 to 200, and select Try. Stop ends them early.
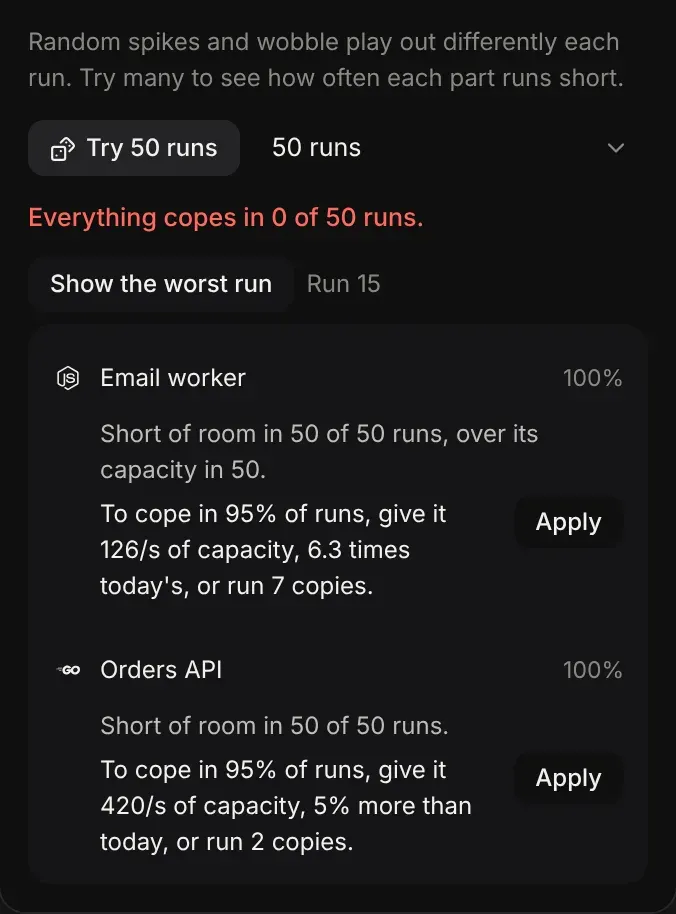
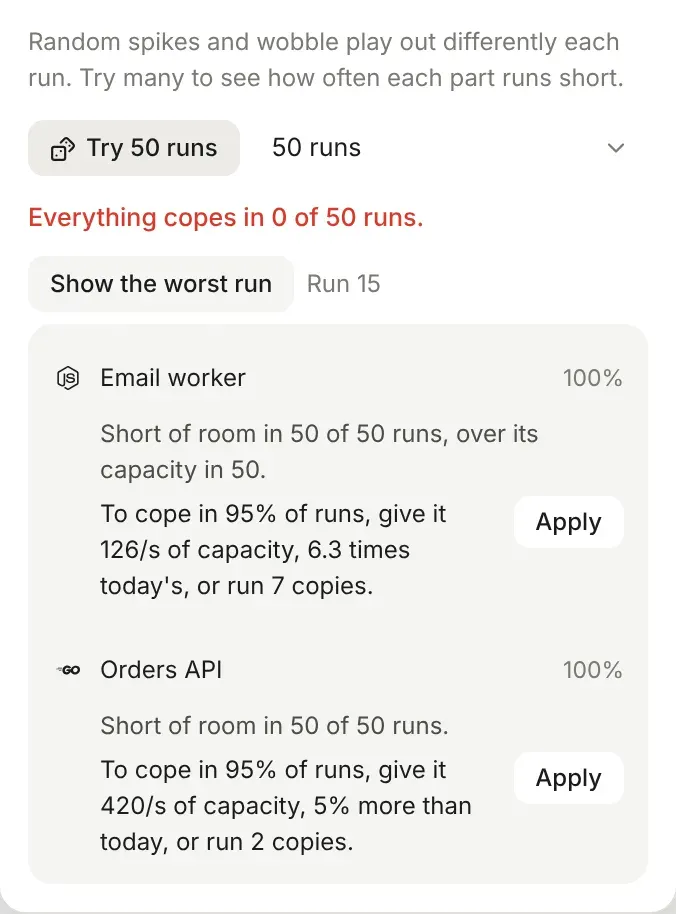
The result says:
- How many runs everything copes in, such as 41 of 50.
- How often each part runs short, over its capacity or turning traffic away.
- The fix that copes in 95% of runs, for each part that runs short, with its Apply. It’s sized from the run at the 95% mark when the runs are put in order of what that part needs.
- Show the worst run, which sets the scenario to that run, so you can watch it on the timeline.
A scenario with no random spikes and no wobble plays the same every time, so it has no odds to try.
In presenting
Section titled “In presenting”Presenting offers scenarios too, so a client can watch Black Friday play out. It leaves out the fixes, saving and people fields. See presenting.